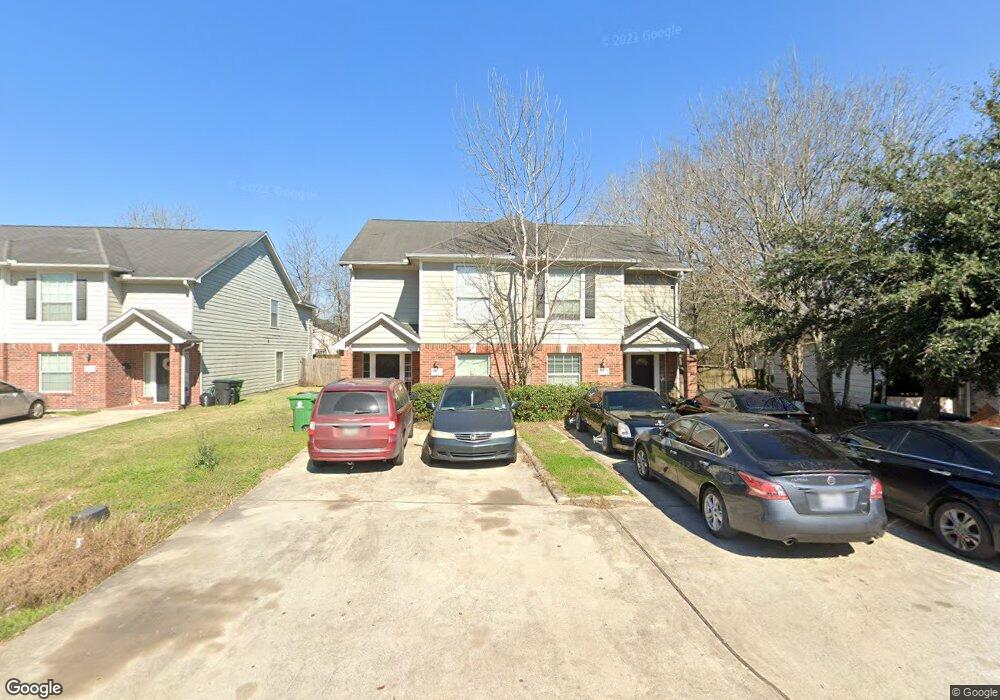
4209 Clover St Unit A Houston, TX 77051
Sunnyside NeighborhoodEstimated Value: $337,000 - $476,000
4
Beds
3
Baths
2,004
Sq Ft
$201/Sq Ft
Est. Value
About This Home
This home is located at 4209 Clover St Unit A, Houston, TX 77051 and is currently estimated at $403,090, approximately $201 per square foot. 4209 Clover St Unit A is a home located in Harris County with nearby schools including Bastian Elementary School, Attucks Middle School, and Worthing High School.
Ownership History
Date
Name
Owned For
Owner Type
Purchase Details
Closed on
Mar 20, 2013
Sold by
Williams Nicole Laray
Bought by
Gong Guoji and Zhang Chunfeng
Current Estimated Value
Purchase Details
Closed on
Oct 29, 2010
Sold by
Woodforest National Bank
Bought by
Williams Nicole Laray and Williams Verlis Wayne
Purchase Details
Closed on
Dec 7, 2009
Sold by
Jackson Billy R
Bought by
Woodforest National Bank Na
Purchase Details
Closed on
Nov 14, 2007
Sold by
E Jordon Inc
Bought by
Jackson Billy R
Home Financials for this Owner
Home Financials are based on the most recent Mortgage that was taken out on this home.
Original Mortgage
$235,000
Interest Rate
6.42%
Mortgage Type
Purchase Money Mortgage
Purchase Details
Closed on
Jan 18, 2007
Sold by
K J Radley & Associates
Bought by
E Jordon Inc
Purchase Details
Closed on
Oct 3, 2005
Sold by
Hensley Carolyn
Bought by
K J Radley & Associates
Create a Home Valuation Report for This Property
The Home Valuation Report is an in-depth analysis detailing your home's value as well as a comparison with similar homes in the area
Home Values in the Area
Average Home Value in this Area
Purchase History
| Date | Buyer | Sale Price | Title Company |
|---|---|---|---|
| Gong Guoji | -- | North American Title Co | |
| Williams Nicole Laray | -- | None Available | |
| Woodforest National Bank Na | $244,785 | None Available | |
| Jackson Billy R | -- | Startex 07 Title Company | |
| E Jordon Inc | -- | None Available | |
| K J Radley & Associates | -- | None Available |
Source: Public Records
Mortgage History
| Date | Status | Borrower | Loan Amount |
|---|---|---|---|
| Previous Owner | Jackson Billy R | $235,000 |
Source: Public Records
Tax History Compared to Growth
Tax History
| Year | Tax Paid | Tax Assessment Tax Assessment Total Assessment is a certain percentage of the fair market value that is determined by local assessors to be the total taxable value of land and additions on the property. | Land | Improvement |
|---|---|---|---|---|
| 2025 | $7,326 | $373,064 | $63,822 | $309,242 |
| 2024 | $7,326 | $372,451 | $63,822 | $308,629 |
| 2023 | $7,326 | $363,629 | $63,822 | $299,807 |
| 2022 | $7,400 | $336,084 | $63,822 | $272,262 |
| 2021 | $6,526 | $280,000 | $46,416 | $233,584 |
| 2020 | $4,775 | $197,200 | $20,307 | $176,893 |
| 2019 | $4,990 | $197,530 | $20,307 | $177,223 |
| 2018 | $4,998 | $197,530 | $20,307 | $177,223 |
| 2017 | $3,897 | $154,100 | $17,406 | $136,694 |
| 2016 | $3,472 | $137,300 | $17,406 | $119,894 |
| 2015 | $3,013 | $125,688 | $14,505 | $111,183 |
| 2014 | $3,013 | $117,226 | $14,505 | $102,721 |
Source: Public Records
Map
Nearby Homes
- 4214 Clover St
- 4301 Clover St
- 4305 Larkspur St
- 4307 Larkspur St
- 4309 Larkspur St
- 4306 Mallow St
- 4122 Mallow St Unit A
- 4347 Clover St
- 4358 Larkspur St
- 4340 Phlox St Unit A B
- 4338 Brinkley St Unit A/B
- 4202 Kewanee St Unit A-D
- 4206 Kewanee St
- 4354 Phlox St
- 4405 Mallow St
- 8203 Scott St
- 4210 Alvin St
- 4102 Kewanee St
- 4402 Phlox St
- 3907 Maggie St
- 4209 Clover St
- 4209 Clover St
- 4209 Clover St
- 4213 Clover St
- 4205 Clover St
- 4205 Clover St Unit A
- 4210 Larkspur St
- 4145 Clover St
- 4217 Clover St
- 4206 Larkspur St
- 4206 Larkspur St Unit 1
- 4206 Larkspur St Unit 2
- 4218 Larkspur St
- 4210 Clover St
- 4206 Clover St
- 4202 Larkspur St
- 4202 Larkspur St Unit A
- 4202 Larkspur St Unit B
- 4141 Clover St
- 4221 Clover St