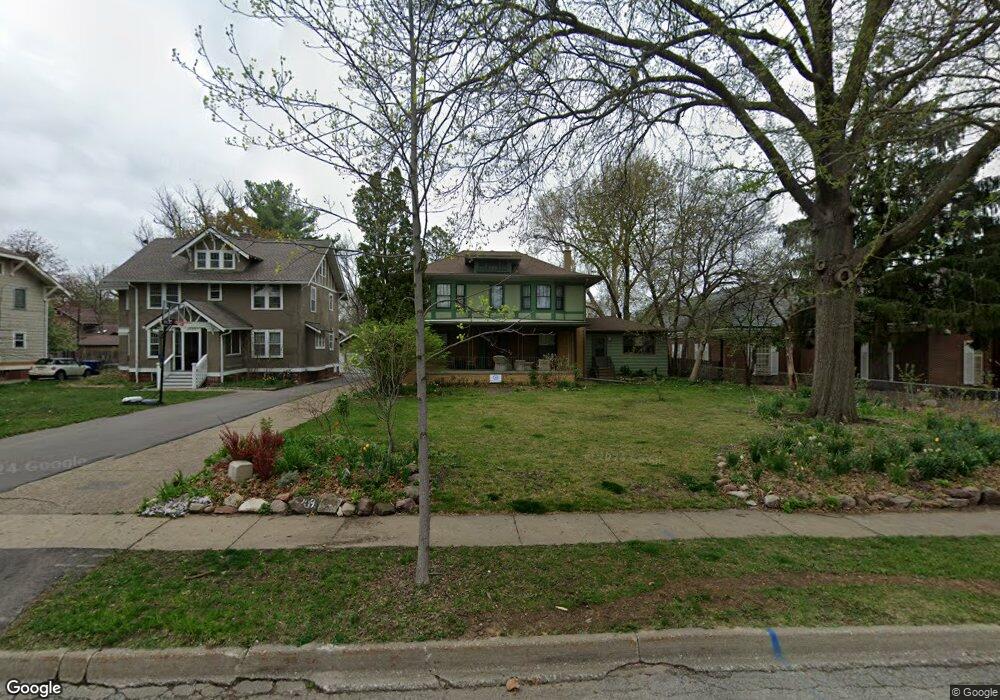
4209 Kingman Blvd Des Moines, IA 50311
Waveland Park NeighborhoodEstimated Value: $394,418 - $455,000
5
Beds
3
Baths
2,498
Sq Ft
$170/Sq Ft
Est. Value
About This Home
This home is located at 4209 Kingman Blvd, Des Moines, IA 50311 and is currently estimated at $424,105, approximately $169 per square foot. 4209 Kingman Blvd is a home located in Polk County with nearby schools including Hubbell Elementary, Merrill Middle School, and Roosevelt High School.
Ownership History
Date
Name
Owned For
Owner Type
Purchase Details
Closed on
Sep 1, 2016
Sold by
James I Jr Lawrence
Bought by
James I Jennifer
Current Estimated Value
Home Financials for this Owner
Home Financials are based on the most recent Mortgage that was taken out on this home.
Original Mortgage
$202,800
Interest Rate
3.5%
Mortgage Type
New Conventional
Purchase Details
Closed on
May 10, 2011
Sold by
Kirchner John H and Kirchner Nora I
Bought by
James Lawrence I and James Jennifer I
Home Financials for this Owner
Home Financials are based on the most recent Mortgage that was taken out on this home.
Original Mortgage
$168,000
Interest Rate
4.88%
Mortgage Type
New Conventional
Purchase Details
Closed on
Apr 9, 2001
Sold by
Kirchner Ann L and Gutz Ann L
Bought by
Kirchner John H and Kirchner Nora I
Create a Home Valuation Report for This Property
The Home Valuation Report is an in-depth analysis detailing your home's value as well as a comparison with similar homes in the area
Home Values in the Area
Average Home Value in this Area
Purchase History
| Date | Buyer | Sale Price | Title Company |
|---|---|---|---|
| James I Jennifer | -- | None Available | |
| James Lawrence I | $209,500 | None Available | |
| Kirchner John H | -- | -- |
Source: Public Records
Mortgage History
| Date | Status | Borrower | Loan Amount |
|---|---|---|---|
| Previous Owner | James I Jennifer | $202,800 | |
| Previous Owner | James Lawrence I | $168,000 |
Source: Public Records
Tax History Compared to Growth
Tax History
| Year | Tax Paid | Tax Assessment Tax Assessment Total Assessment is a certain percentage of the fair market value that is determined by local assessors to be the total taxable value of land and additions on the property. | Land | Improvement |
|---|---|---|---|---|
| 2025 | $6,330 | $363,200 | $80,000 | $283,200 |
| 2024 | $6,330 | $332,200 | $73,100 | $259,100 |
| 2023 | $6,346 | $332,200 | $73,100 | $259,100 |
| 2022 | $6,294 | $278,100 | $63,500 | $214,600 |
| 2021 | $6,092 | $278,100 | $63,500 | $214,600 |
| 2020 | $6,322 | $252,700 | $58,100 | $194,600 |
| 2019 | $5,958 | $252,700 | $58,100 | $194,600 |
| 2018 | $5,892 | $230,200 | $52,500 | $177,700 |
| 2017 | $5,296 | $230,200 | $52,500 | $177,700 |
| 2016 | $5,154 | $204,300 | $46,200 | $158,100 |
| 2015 | $5,154 | $204,300 | $46,200 | $158,100 |
| 2014 | $4,950 | $202,200 | $42,500 | $159,700 |
Source: Public Records
Map
Nearby Homes
- 4200 Kingman Blvd
- 1001 42nd St
- 1008 Kingman Cir
- 1021 45th St
- 4036 Plainview Dr
- 4303 Crocker St
- 1055 46th St
- 4000 University Ave Unit 7
- 870 39th St
- 1206 39th St
- 1005 38th St
- 1314 44th St
- 3821 University Ave
- 1070 37th St
- 812 Polk Blvd
- 4902 University Ave Unit 335
- 1347 44th St
- 725 40th St
- 3827 Carpenter Ave
- 689 42nd St
- 4303 Kingman Blvd
- 4307 Kingman Blvd
- 4311 Kingman Blvd
- 4315 Kingman Blvd
- 1055 44th St
- 4224 Kingman Blvd
- 1059 44th St
- 4226 Kingman Blvd
- 4228 Kingman Blvd
- 4319 Kingman Blvd
- 1072 42nd St
- 1065 44th St
- 4220 Kingman Blvd
- 1069 44th St
- 1074 42nd St
- 4312 Kingman Blvd
- 4123 Kingman Blvd
- 1063 42nd St
- 1076 42nd St
- 1075 44th St