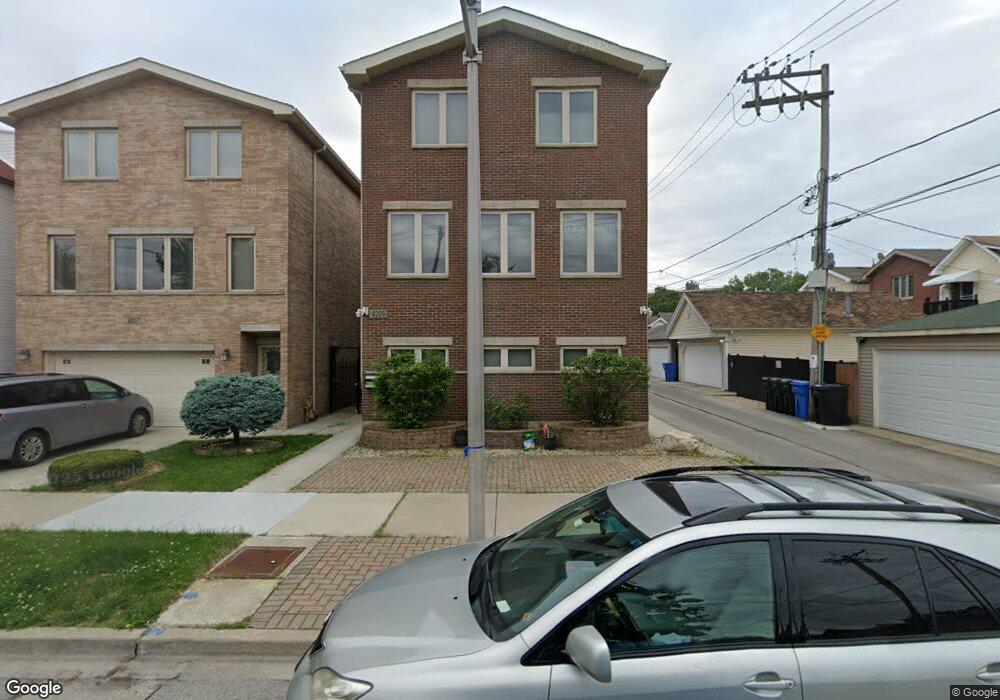
4209 S Normal Ave Chicago, IL 60609
Bridgeport NeighborhoodEstimated Value: $578,631 - $747,000
3
Beds
4
Baths
2,500
Sq Ft
$264/Sq Ft
Est. Value
About This Home
This home is located at 4209 S Normal Ave, Chicago, IL 60609 and is currently estimated at $659,908, approximately $263 per square foot. 4209 S Normal Ave is a home located in Cook County with nearby schools including Hendricks Elementary Community Academy, St Gabriel Elementary School, and Bridgeport Catholic Academy - South Campus.
Ownership History
Date
Name
Owned For
Owner Type
Purchase Details
Closed on
Mar 18, 2022
Sold by
Ng Spencer and Chen Zhenzhen
Bought by
Seid David and Yu Shelly
Current Estimated Value
Home Financials for this Owner
Home Financials are based on the most recent Mortgage that was taken out on this home.
Original Mortgage
$440,000
Outstanding Balance
$348,524
Interest Rate
3.13%
Estimated Equity
$311,384
Purchase Details
Closed on
Nov 12, 2020
Sold by
Ng Spencer and Chen Zhenzhen
Bought by
Ng Spencer and Chen Zhenzhen
Home Financials for this Owner
Home Financials are based on the most recent Mortgage that was taken out on this home.
Original Mortgage
$206,000
Interest Rate
2.5%
Mortgage Type
New Conventional
Purchase Details
Closed on
Sep 27, 2013
Sold by
Ng Spencer and Chen Janice
Bought by
Ng Spencer and Ng Eric
Purchase Details
Closed on
Sep 9, 2011
Sold by
Kasper Development Ltd
Bought by
Ng Spencer and Ng Morgan
Home Financials for this Owner
Home Financials are based on the most recent Mortgage that was taken out on this home.
Original Mortgage
$240,000
Interest Rate
5.12%
Mortgage Type
Adjustable Rate Mortgage/ARM
Create a Home Valuation Report for This Property
The Home Valuation Report is an in-depth analysis detailing your home's value as well as a comparison with similar homes in the area
Home Values in the Area
Average Home Value in this Area
Purchase History
| Date | Buyer | Sale Price | Title Company |
|---|---|---|---|
| Seid David | $550,000 | -- | |
| Ng Spencer | -- | Chicago Title | |
| Ng Spencer | -- | None Available | |
| Ng Spencer | $345,000 | Cti |
Source: Public Records
Mortgage History
| Date | Status | Borrower | Loan Amount |
|---|---|---|---|
| Open | Seid David | $440,000 | |
| Previous Owner | Ng Spencer | $206,000 | |
| Previous Owner | Ng Spencer | $240,000 |
Source: Public Records
Tax History
| Year | Tax Paid | Tax Assessment Tax Assessment Total Assessment is a certain percentage of the fair market value that is determined by local assessors to be the total taxable value of land and additions on the property. | Land | Improvement |
|---|---|---|---|---|
| 2025 | $7,516 | $52,000 | $2,006 | $49,994 |
| 2024 | $7,516 | $52,000 | $2,006 | $49,994 |
| 2023 | $6,623 | $35,620 | $2,508 | $33,112 |
| 2022 | $6,623 | $35,620 | $2,508 | $33,112 |
| 2021 | $6,493 | $35,620 | $2,508 | $33,112 |
| 2020 | $6,180 | $30,842 | $2,508 | $28,334 |
| 2019 | $6,196 | $34,269 | $2,508 | $31,761 |
| 2018 | $6,091 | $34,269 | $2,508 | $31,761 |
| 2017 | $6,224 | $32,290 | $2,257 | $30,033 |
| 2016 | $5,967 | $32,290 | $2,257 | $30,033 |
| 2015 | $6,630 | $38,803 | $2,257 | $36,546 |
| 2014 | $5,440 | $31,889 | $2,131 | $29,758 |
| 2013 | $5,322 | $31,889 | $2,131 | $29,758 |
Source: Public Records
Map
Nearby Homes
- 604 W 43rd St
- 4206 S Wells St
- 4411 S Wallace St
- 245 W 43rd St
- 5131 S Union Ave
- 4250 S Wells St
- 4204 S Wentworth Ave
- 4166 S Emerald Ave
- 4160 S Emerald Ave
- 510 W 45th St
- 4452 S Shields Ave
- 4167 S Halsted St
- 4412 S Wells St
- 516 W 45th Place
- 4451 S Princeton Ave
- 4353 S Halsted St
- 5014 S Union Ave
- 4500 S Wells St
- 4547 S Union Ave
- 450 W 46th Place
- 4209 S Normal Ave
- 4209 S Normal Ave
- 4207 S Normal Ave
- 4207 S Normal Ave
- 4205 S Normal Ave
- 449 W 42nd St
- 458 W 42nd Place
- 503 W 42nd St
- 450 W 42nd Place
- 443 W 42nd St
- 505 W 42nd St
- 448 W 42nd Place
- 454 W 42nd Place
- 500 W 42nd Place
- 441 W 42nd St
- 444 W 42nd Place
- 444 W 42nd Place Unit 446
- 509 W 42nd St
- 504 W 42nd Place
- 511 W 42nd St