
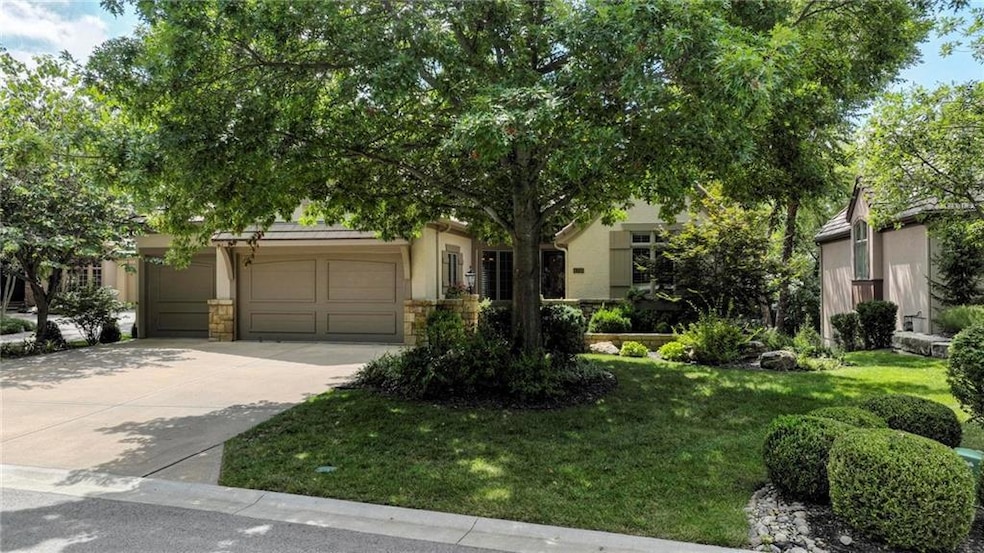


4209 W 114th St Leawood, KS 66211
Estimated payment $6,596/month
Total Views
595
4
Beds
4.5
Baths
4,114
Sq Ft
$242
Price per Sq Ft
Highlights
- Deck
- Family Room with Fireplace
- Breakfast Area or Nook
- Leawood Elementary School Rated A
- Wood Flooring
- Formal Dining Room
About This Home
Beautiful reverse 1.5-story nestled on a private, tree-lined lot in The Woods Villas! This thoughtfully designed floor plan offers a main-level primary suite plus a second bedroom for convenience and flexibility. Enjoy an open layout filled with natural southern light, with the kitchen and great room flowing seamlessly to a deck and screened porch—perfect for indoor/outdoor living. The finished lower level provides 2 additional bedrooms, 2 full baths, a spacious family room with bar, and walk-out access to the patio. Three-car attached garage. Walking trails just across the street complete this ideal setting!
Listing Agent
Compass Realty Group Brokerage Phone: 913-980-5696 License #BR00020438 Listed on: 08/19/2025
Home Details
Home Type
- Single Family
Est. Annual Taxes
- $10,682
Year Built
- Built in 2004
HOA Fees
- $285 Monthly HOA Fees
Parking
- 3 Car Attached Garage
Home Design
- Villa
- Stone Trim
- Stucco
Interior Spaces
- Family Room with Fireplace
- 2 Fireplaces
- Great Room with Fireplace
- Living Room
- Formal Dining Room
- Finished Basement
- Basement Fills Entire Space Under The House
- Laundry on main level
Kitchen
- Breakfast Area or Nook
- Gas Range
- Dishwasher
- Stainless Steel Appliances
- Disposal
Flooring
- Wood
- Tile
Bedrooms and Bathrooms
- 4 Bedrooms
Schools
- Leawood Elementary School
- Blue Valley North High School
Additional Features
- Deck
- 0.29 Acre Lot
- Forced Air Zoned Heating and Cooling System
Community Details
- Association fees include curbside recycling, lawn service, snow removal, trash
- The Woods Villas Subdivision
Listing and Financial Details
- Assessor Parcel Number HP97650000 0051
- $0 special tax assessment
Map
Create a Home Valuation Report for This Property
The Home Valuation Report is an in-depth analysis detailing your home's value as well as a comparison with similar homes in the area
Home Values in the Area
Average Home Value in this Area
Tax History
| Year | Tax Paid | Tax Assessment Tax Assessment Total Assessment is a certain percentage of the fair market value that is determined by local assessors to be the total taxable value of land and additions on the property. | Land | Improvement |
|---|---|---|---|---|
| 2024 | $10,682 | $95,450 | $21,672 | $73,778 |
| 2023 | $10,620 | $93,840 | $21,672 | $72,168 |
| 2022 | $10,970 | $94,818 | $21,672 | $73,146 |
| 2021 | $10,760 | $88,987 | $21,672 | $67,315 |
| 2020 | $10,922 | $88,493 | $21,672 | $66,821 |
| 2019 | $10,471 | $83,340 | $19,697 | $63,643 |
| 2018 | $10,399 | $81,282 | $19,697 | $61,585 |
| 2017 | $10,170 | $78,177 | $17,901 | $60,276 |
| 2016 | $10,387 | $79,913 | $17,122 | $62,791 |
| 2015 | $10,543 | $80,121 | $17,124 | $62,997 |
| 2013 | -- | $82,766 | $21,088 | $61,678 |
Source: Public Records
Property History
| Date | Event | Price | Change | Sq Ft Price |
|---|---|---|---|---|
| 08/22/2025 08/22/25 | Pending | -- | -- | -- |
| 08/21/2025 08/21/25 | For Sale | $995,000 | -- | $242 / Sq Ft |
Source: Heartland MLS
Purchase History
| Date | Type | Sale Price | Title Company |
|---|---|---|---|
| Warranty Deed | -- | Security Land Title Company | |
| Warranty Deed | -- | Security Land Title Company |
Source: Public Records
Mortgage History
| Date | Status | Loan Amount | Loan Type |
|---|---|---|---|
| Open | $405,278 | Purchase Money Mortgage | |
| Previous Owner | $636,000 | Construction |
Source: Public Records
Similar Homes in Leawood, KS
Source: Heartland MLS
MLS Number: 2569871
APN: HP97650000-0051
Disclaimer: Certain information contained herein is derived from information provided by parties other than Homes.com. All information provided is deemed reliable, but is not guaranteed to be accurate and should be independently verified.
![]() Based on information submitted to the MLS GRID as of [see last changed date above]. All data is obtained from various sources and may not have been verified by broker or MLS GRID. Supplied Open House Information is subject to change without notice. All information should be independently reviewed and verified for accuracy. Properties may or may not be listed by the office/agent presenting the information. Some IDX listings have been excluded from this website. Prices displayed on all Sold listings are the Last Known Listing Price and may not be the actual selling price.
Based on information submitted to the MLS GRID as of [see last changed date above]. All data is obtained from various sources and may not have been verified by broker or MLS GRID. Supplied Open House Information is subject to change without notice. All information should be independently reviewed and verified for accuracy. Properties may or may not be listed by the office/agent presenting the information. Some IDX listings have been excluded from this website. Prices displayed on all Sold listings are the Last Known Listing Price and may not be the actual selling price.
Listing Information presented by local MLS brokerage: TEN-X, INC., local REALTOR®- Arlene Richardson - (888)952-6393
The Digital Millennium Copyright Act of 1998, 17 U.S.C. § 512 (the “DMCA”) provides recourse for copyright owners who believe that material appearing on the Internet infringes their rights under U.S. copyright law. If you believe in good faith that any content or material made available in connection with our website or services infringes your copyright, you (or your agent) may send us a notice requesting that the content or material be removed, or access to it blocked.
Notices must be sent in writing by email to DMCAnotice@MLSGrid.com.
The DMCA requires that your notice of alleged copyright infringement include the following information:
(1) description of the copyrighted work that is the subject of claimed infringement;
(2) description of the alleged infringing content and information sufficient to permit us to locate the content;
(3) contact information for you, including your address, telephone number and email address;
(4) a statement by you that you have a good faith belief that the content in the manner complained of is not authorized by the copyright owner, or its agent, or by the operation of any law;
(5) a statement by you, signed under penalty of perjury, that the information in the notification is accurate and that you have the authority to enforce the copyrights that are claimed to be infringed; and
(6) a physical or electronic signature of the copyright owner or a person authorized to act on the copyright owner’s behalf. Failure to include all of the above information may result in the delay of the processing of your complaint.
Nearby Homes
- 4217 W 114th St
- 11349 Buena Vista St
- 11616 Tomahawk Creek Pkwy Unit D
- 11626 Tomahawk Creek Pkwy Unit J
- 4317 W 112th Terrace
- 11417 Granada Ct
- 11221 Granada Ln
- 4300 W 112th Terrace
- 4300 W 112th St
- 4800 W 112th Terrace
- 4328 W 110th St
- 4140 W 111th Terrace
- 11210 Juniper Dr
- 5004 W 111th Terrace
- 3705 W 119th Terrace
- 3109 W 118th St
- 3044 W 118th Terrace
- 3913 W 121st Terrace
- 4837 W 121st St
- 10531 Mission Rd Unit 304