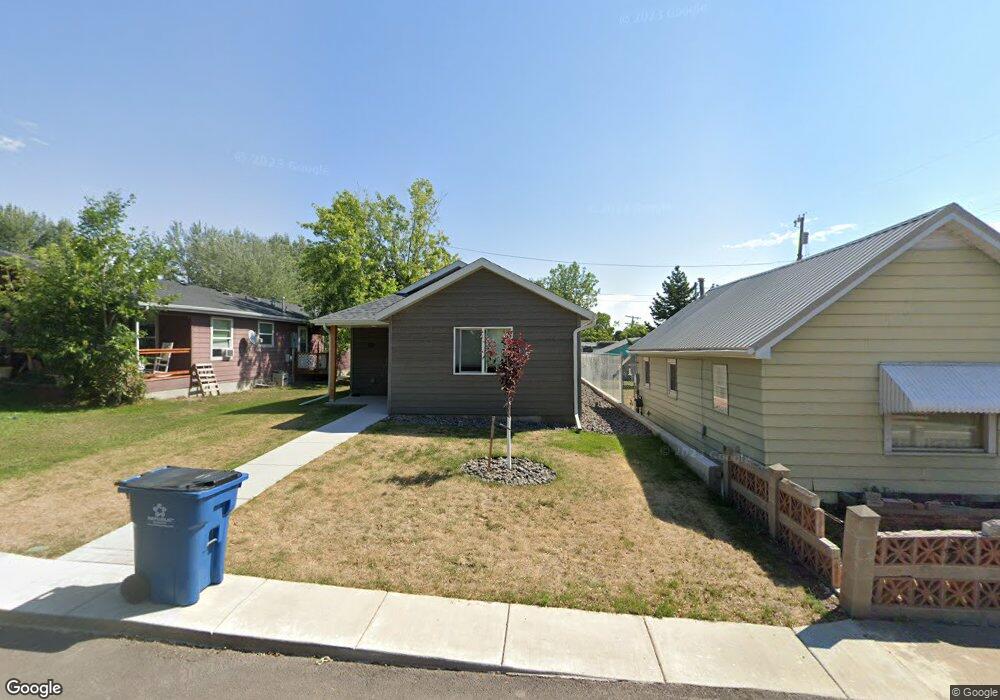
421 17th St Black Eagle, MT 59414
Estimated Value: $346,000 - $376,000
3
Beds
2
Baths
1,296
Sq Ft
$280/Sq Ft
Est. Value
About This Home
This home is located at 421 17th St, Black Eagle, MT 59414 and is currently estimated at $362,630, approximately $279 per square foot. 421 17th St is a home located in Cascade County with nearby schools including Sacajawea School, Riverview School, and North Middle School.
Ownership History
Date
Name
Owned For
Owner Type
Purchase Details
Closed on
May 14, 2025
Sold by
Wanamaker Kevin J and Anderson Karrie R
Bought by
Walsh Holly Ann
Current Estimated Value
Home Financials for this Owner
Home Financials are based on the most recent Mortgage that was taken out on this home.
Original Mortgage
$291,920
Outstanding Balance
$290,884
Interest Rate
6.64%
Mortgage Type
New Conventional
Estimated Equity
$71,746
Purchase Details
Closed on
Jan 19, 2023
Sold by
Dewitt Investment Corporation
Bought by
Wanamaker Kevin J and Anderson Karrie R
Purchase Details
Closed on
Oct 7, 2021
Sold by
Jensen Chilo A
Bought by
De Wit Invetsments Corporation
Purchase Details
Closed on
May 17, 2021
Sold by
Hughes Carie L and Korst Carie L
Bought by
Jensen Chilo A
Purchase Details
Closed on
May 22, 2015
Sold by
Brady Rosalie A
Bought by
Stensrud Christina M and Jensen Chilo A
Create a Home Valuation Report for This Property
The Home Valuation Report is an in-depth analysis detailing your home's value as well as a comparison with similar homes in the area
Purchase History
| Date | Buyer | Sale Price | Title Company |
|---|---|---|---|
| Walsh Holly Ann | -- | Chicago Title | |
| Wanamaker Kevin J | -- | Flying S Title | |
| De Wit Invetsments Corporation | -- | Legacy Title | |
| Jensen Chilo A | -- | Legacy Title | |
| Stensrud Christina M | -- | None Available |
Source: Public Records
Mortgage History
| Date | Status | Borrower | Loan Amount |
|---|---|---|---|
| Open | Walsh Holly Ann | $291,920 |
Source: Public Records
Tax History
| Year | Tax Paid | Tax Assessment Tax Assessment Total Assessment is a certain percentage of the fair market value that is determined by local assessors to be the total taxable value of land and additions on the property. | Land | Improvement |
|---|---|---|---|---|
| 2025 | $2,356 | $354,200 | $0 | $0 |
| 2024 | $2,906 | $301,700 | $0 | $0 |
| 2023 | $2,804 | $301,700 | $0 | $0 |
| 2022 | $709 | $17,079 | $0 | $0 |
| 2021 | $352 | $41,979 | $0 | $0 |
| 2020 | $889 | $39,655 | $0 | $0 |
| 2019 | $870 | $39,655 | $0 | $0 |
| 2018 | $789 | $31,809 | $0 | $0 |
| 2017 | $226 | $31,809 | $0 | $0 |
| 2016 | $814 | $43,820 | $0 | $0 |
| 2015 | $328 | $43,820 | $0 | $0 |
| 2014 | $717 | $18,504 | $0 | $0 |
Source: Public Records
Map
Nearby Homes
- 1925 Colorado Ave
- Nhn 28th Ave NE
- 3201 12th St NE
- 3101 Southview Ct
- 748 32nd Ave NE
- 708 Riverview Dr E
- 633 26th Ave NE
- 1701 8th Ave N
- 776 33a Ave NE
- 781 33a Ave NE
- 712 19th St N
- 604 27th Ave NE
- 1208 8th Ave N
- 3f Smelter Ave NE
- 1217 7th Ave N
- 603 & 605 8th Ave N
- 1521 6th Ave N
- 1512 6th Ave N
- 501 23rd Ave NE
- 2025 6th Ave N
Your Personal Tour Guide
Ask me questions while you tour the home.