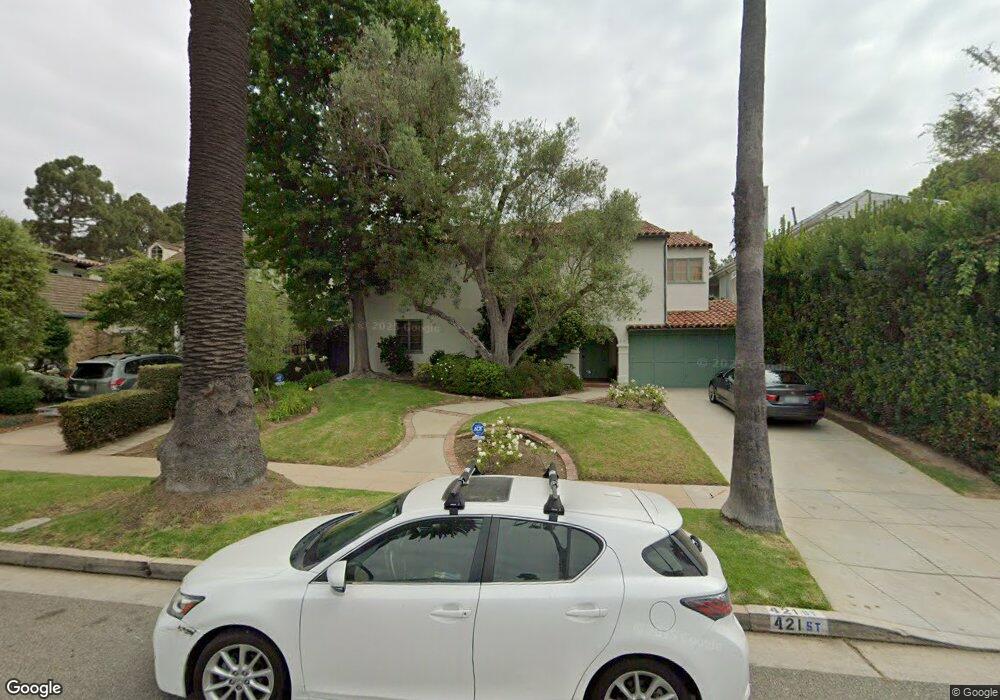
421 21st St Santa Monica, CA 90402
North of Montana NeighborhoodEstimated Value: $5,503,000 - $6,933,000
5
Beds
4
Baths
3,709
Sq Ft
$1,644/Sq Ft
Est. Value
About This Home
This home is located at 421 21st St, Santa Monica, CA 90402 and is currently estimated at $6,098,474, approximately $1,644 per square foot. 421 21st St is a home located in Los Angeles County with nearby schools including Franklin Elementary School, Lincoln Middle School, and Santa Monica High School.
Ownership History
Date
Name
Owned For
Owner Type
Purchase Details
Closed on
Nov 9, 2019
Sold by
Arnold Donald Bruce and Liman Emily Ruth
Bought by
Arnold Donald Bruce and Liman Emily
Current Estimated Value
Purchase Details
Closed on
May 17, 2000
Sold by
Gabrinetti Paul A and Gabrinetti Daun E
Bought by
Arnold Donald Bruce and Liman Emily Ruth
Purchase Details
Closed on
Apr 4, 1995
Sold by
Gabrinetti Daun Elaine Baker and Baker Daun
Bought by
Gabrinetti Paul A and Gabrinetti Daun Elaine Baker
Home Financials for this Owner
Home Financials are based on the most recent Mortgage that was taken out on this home.
Original Mortgage
$425,000
Interest Rate
5%
Create a Home Valuation Report for This Property
The Home Valuation Report is an in-depth analysis detailing your home's value as well as a comparison with similar homes in the area
Home Values in the Area
Average Home Value in this Area
Purchase History
| Date | Buyer | Sale Price | Title Company |
|---|---|---|---|
| Arnold Donald Bruce | -- | None Available | |
| Arnold Donald Bruce | $1,877,000 | Lawyers Title Company | |
| Gabrinetti Paul A | -- | Chicago Title Insurance Co |
Source: Public Records
Mortgage History
| Date | Status | Borrower | Loan Amount |
|---|---|---|---|
| Previous Owner | Gabrinetti Paul A | $425,000 |
Source: Public Records
Tax History Compared to Growth
Tax History
| Year | Tax Paid | Tax Assessment Tax Assessment Total Assessment is a certain percentage of the fair market value that is determined by local assessors to be the total taxable value of land and additions on the property. | Land | Improvement |
|---|---|---|---|---|
| 2025 | $33,658 | $2,884,908 | $1,548,815 | $1,336,093 |
| 2024 | $33,658 | $2,828,343 | $1,518,447 | $1,309,896 |
| 2023 | $33,122 | $2,772,886 | $1,488,674 | $1,284,212 |
| 2022 | $32,721 | $2,718,517 | $1,459,485 | $1,259,032 |
| 2021 | $31,925 | $2,665,214 | $1,430,868 | $1,234,346 |
| 2019 | $31,397 | $2,586,165 | $1,388,429 | $1,197,736 |
| 2018 | $29,500 | $2,535,456 | $1,361,205 | $1,174,251 |
| 2016 | $28,428 | $2,437,003 | $1,308,349 | $1,128,654 |
| 2015 | $28,063 | $2,400,398 | $1,288,697 | $1,111,701 |
| 2014 | $27,649 | $2,353,379 | $1,263,454 | $1,089,925 |
Source: Public Records
Map
Nearby Homes