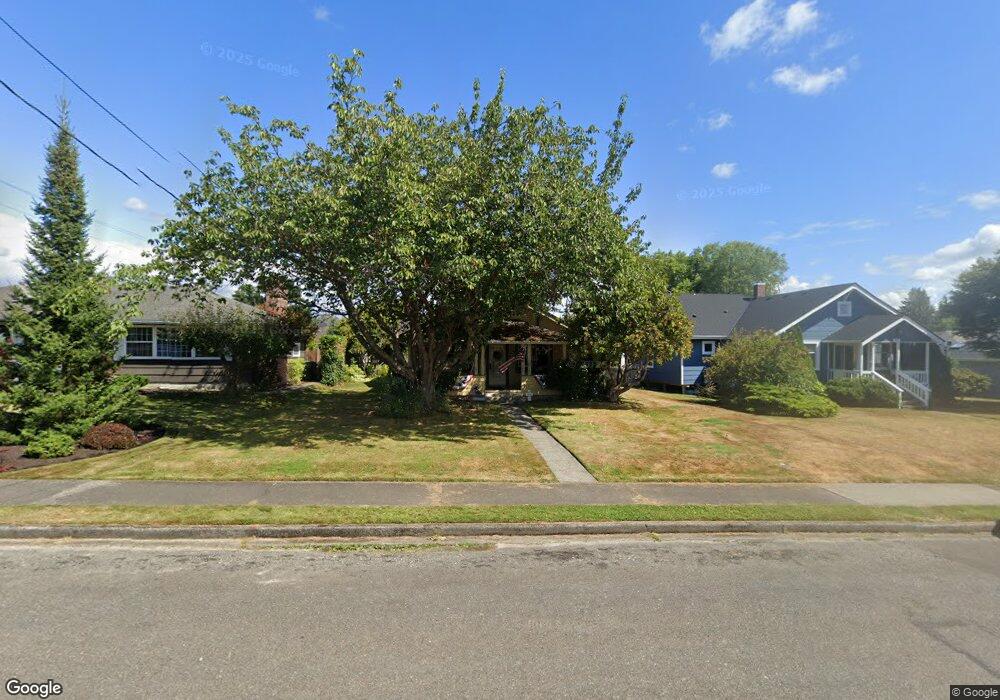
421 Avenue G Snohomish, WA 98290
Estimated Value: $607,788 - $667,000
3
Beds
1
Bath
1,101
Sq Ft
$583/Sq Ft
Est. Value
About This Home
This home is located at 421 Avenue G, Snohomish, WA 98290 and is currently estimated at $642,197, approximately $583 per square foot. 421 Avenue G is a home located in Snohomish County with nearby schools including Central Emerson Elementary School, Centennial Middle School, and Snohomish High School.
Ownership History
Date
Name
Owned For
Owner Type
Purchase Details
Closed on
Jun 16, 2003
Sold by
Wilson Douglas R
Bought by
Wilson Douglas R and Wilson Carrie A
Current Estimated Value
Home Financials for this Owner
Home Financials are based on the most recent Mortgage that was taken out on this home.
Original Mortgage
$149,600
Outstanding Balance
$27,771
Interest Rate
5.37%
Mortgage Type
Purchase Money Mortgage
Estimated Equity
$614,426
Purchase Details
Closed on
Dec 16, 1998
Sold by
Murphy Michael D and Murphy Heather M
Bought by
Wilson Douglas R
Home Financials for this Owner
Home Financials are based on the most recent Mortgage that was taken out on this home.
Original Mortgage
$152,981
Interest Rate
6.91%
Mortgage Type
FHA
Purchase Details
Closed on
Sep 26, 1996
Sold by
Simpson Jay E and Simpson Tillie A
Bought by
Murphy Michael D and Murphy Heather M
Home Financials for this Owner
Home Financials are based on the most recent Mortgage that was taken out on this home.
Original Mortgage
$107,950
Interest Rate
7.95%
Mortgage Type
Balloon
Create a Home Valuation Report for This Property
The Home Valuation Report is an in-depth analysis detailing your home's value as well as a comparison with similar homes in the area
Home Values in the Area
Average Home Value in this Area
Purchase History
| Date | Buyer | Sale Price | Title Company |
|---|---|---|---|
| Wilson Douglas R | -- | Old Republic Title Ltd | |
| Wilson Douglas R | $155,000 | -- | |
| Murphy Michael D | $119,950 | -- |
Source: Public Records
Mortgage History
| Date | Status | Borrower | Loan Amount |
|---|---|---|---|
| Open | Wilson Douglas R | $149,600 | |
| Closed | Wilson Douglas R | $152,981 | |
| Previous Owner | Murphy Michael D | $107,950 |
Source: Public Records
Tax History Compared to Growth
Tax History
| Year | Tax Paid | Tax Assessment Tax Assessment Total Assessment is a certain percentage of the fair market value that is determined by local assessors to be the total taxable value of land and additions on the property. | Land | Improvement |
|---|---|---|---|---|
| 2025 | $4,793 | $532,500 | $400,000 | $132,500 |
| 2024 | $4,793 | $492,500 | $360,000 | $132,500 |
| 2023 | $4,832 | $550,500 | $390,000 | $160,500 |
| 2022 | $4,414 | $408,700 | $271,000 | $137,700 |
| 2020 | $3,922 | $337,500 | $216,000 | $121,500 |
| 2019 | $3,638 | $319,500 | $200,000 | $119,500 |
| 2018 | $3,912 | $287,700 | $180,000 | $107,700 |
| 2017 | $3,399 | $254,800 | $155,000 | $99,800 |
| 2016 | $3,087 | $224,300 | $128,000 | $96,300 |
| 2015 | $2,784 | $193,600 | $110,000 | $83,600 |
| 2013 | $2,353 | $158,900 | $70,000 | $88,900 |
Source: Public Records
Map
Nearby Homes
- 417 Avenue F Unit C
- 431 Avenue F
- 302 Avenue E
- 322 Avenue D
- 325 J Ave Unit B
- 325 J Ave Unit A
- 526 Avenue J
- 1412 2nd St
- 302 J Ave Unit 3
- 307 Avenue C
- 620 Avenue B Unit 9
- 2101 5th Place
- 9624 Lowell Snohomish River Rd
- 725 Covington (Lot 4) Ave
- 727 Covington (Lot 5) Ave
- 726 Covington (Lot 7) Ave
- 728 Covington (Lot 6) Ave
- 1101 10th St Unit 31
- 612 5th St
- 1022 Avenue B