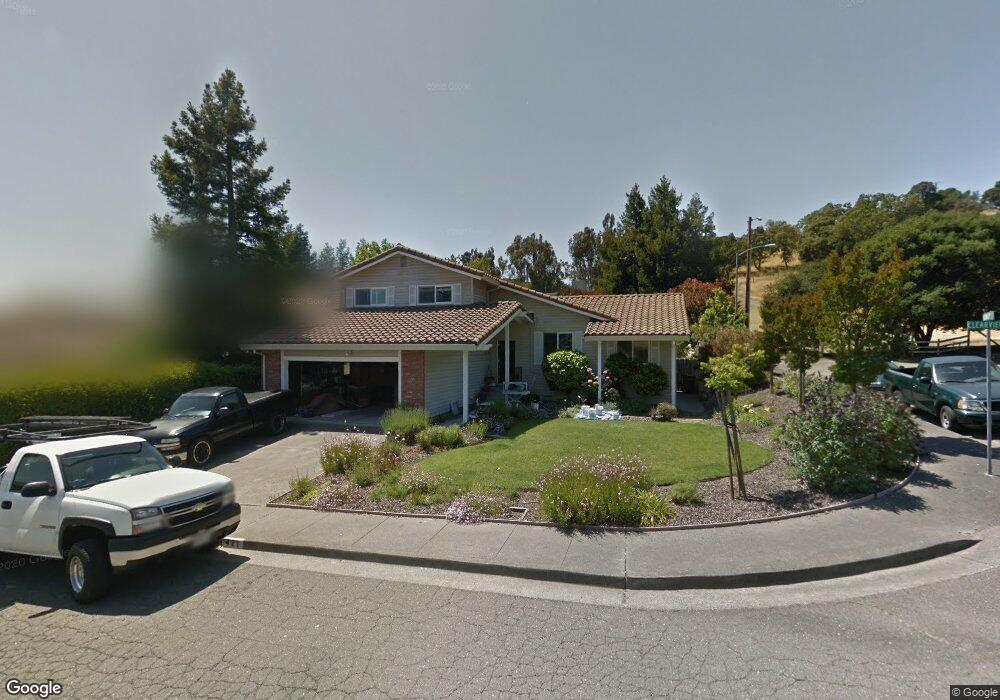
421 Clearview Place Petaluma, CA 94952
Western Petaluma NeighborhoodEstimated Value: $1,016,000 - $1,122,000
3
Beds
3
Baths
2,114
Sq Ft
$509/Sq Ft
Est. Value
About This Home
This home is located at 421 Clearview Place, Petaluma, CA 94952 and is currently estimated at $1,076,009, approximately $508 per square foot. 421 Clearview Place is a home located in Sonoma County with nearby schools including McNear Elementary School, Petaluma Junior High School, and Petaluma High School.
Ownership History
Date
Name
Owned For
Owner Type
Purchase Details
Closed on
Jan 22, 2021
Sold by
Allan Cynthia Jean
Bought by
Allan Robert M and Revoc Cynthia
Current Estimated Value
Purchase Details
Closed on
Jan 19, 2021
Sold by
Robert M Allan M and Robert Cynthia J
Bought by
Robert M Allan And Cynthia J Allan Revocable and Allan
Purchase Details
Closed on
Feb 13, 2007
Sold by
White Cynthia
Bought by
Allan Cynthia J M and Allan Robert M
Purchase Details
Closed on
Mar 3, 1999
Sold by
House Billy J & Florence A Trust and Billy J
Bought by
White Cynthia
Home Financials for this Owner
Home Financials are based on the most recent Mortgage that was taken out on this home.
Original Mortgage
$110,000
Interest Rate
6.7%
Purchase Details
Closed on
Nov 12, 1993
Sold by
House Billy J and House Florence A
Bought by
House Billy J and House Florence A
Create a Home Valuation Report for This Property
The Home Valuation Report is an in-depth analysis detailing your home's value as well as a comparison with similar homes in the area
Home Values in the Area
Average Home Value in this Area
Purchase History
| Date | Buyer | Sale Price | Title Company |
|---|---|---|---|
| Allan Robert M | -- | -- | |
| Robert M Allan And Cynthia J Allan Revocable | -- | Copenhaver Erika | |
| Allan Cynthia J M | -- | None Available | |
| White Cynthia | $310,000 | Chicago Title Co | |
| House Billy J | -- | -- |
Source: Public Records
Mortgage History
| Date | Status | Borrower | Loan Amount |
|---|---|---|---|
| Previous Owner | White Cynthia | $110,000 |
Source: Public Records
Tax History
| Year | Tax Paid | Tax Assessment Tax Assessment Total Assessment is a certain percentage of the fair market value that is determined by local assessors to be the total taxable value of land and additions on the property. | Land | Improvement |
|---|---|---|---|---|
| 2025 | $5,341 | $485,984 | $250,832 | $235,152 |
| 2024 | $5,341 | $476,456 | $245,914 | $230,542 |
| 2023 | $5,341 | $467,115 | $241,093 | $226,022 |
| 2022 | $5,148 | $457,957 | $236,366 | $221,591 |
| 2021 | $5,052 | $448,979 | $231,732 | $217,247 |
| 2020 | $5,095 | $444,376 | $229,356 | $215,020 |
| 2019 | $4,954 | $435,663 | $224,859 | $210,804 |
| 2018 | $4,934 | $427,121 | $220,450 | $206,671 |
| 2017 | $4,831 | $418,747 | $216,128 | $202,619 |
| 2016 | $4,713 | $410,538 | $211,891 | $198,647 |
| 2015 | $4,647 | $404,373 | $208,709 | $195,664 |
| 2014 | $4,624 | $396,453 | $204,621 | $191,832 |
Source: Public Records
Map
Nearby Homes
- 22 Oak Knoll Ct
- 134 Grevillia Dr
- 1309 D Street Extension
- 1021 Mcnear Ave
- 21 Branching Way
- 11 10th St
- 45 Augusta Cir
- 12 Haven Dr
- 618 E St
- 100 Orchard Ln
- 16 7th St
- 720 Petaluma Blvd S Unit 28
- 1280 Petaluma Blvd S
- 534 Jade St
- 105 G St
- 417 Jacquelyn Ln
- 1805 Alvarado St
- 131 Liberty St
- 136 Court St
- 0 Lakeville St
- 417 Clearview Place
- 106 Dawn Place
- 425 Clearview Place
- 413 Clearview Place
- 301 Smith Dr
- 102 Dawn Place
- 409 Clearview Place
- 305 Smith Dr
- 429 Clearview Place
- 110 Dawn Place
- 404 Clearview Place
- 300 Smith Dr
- 304 Smith Dr
- 405 Clearview Place
- 309 Smith Dr
- 119 Dawn Place
- 114 Dawn Place
- 433 Clearview Place
- 308 Smith Dr
- 408 Clearview Place
Your Personal Tour Guide
Ask me questions while you tour the home.