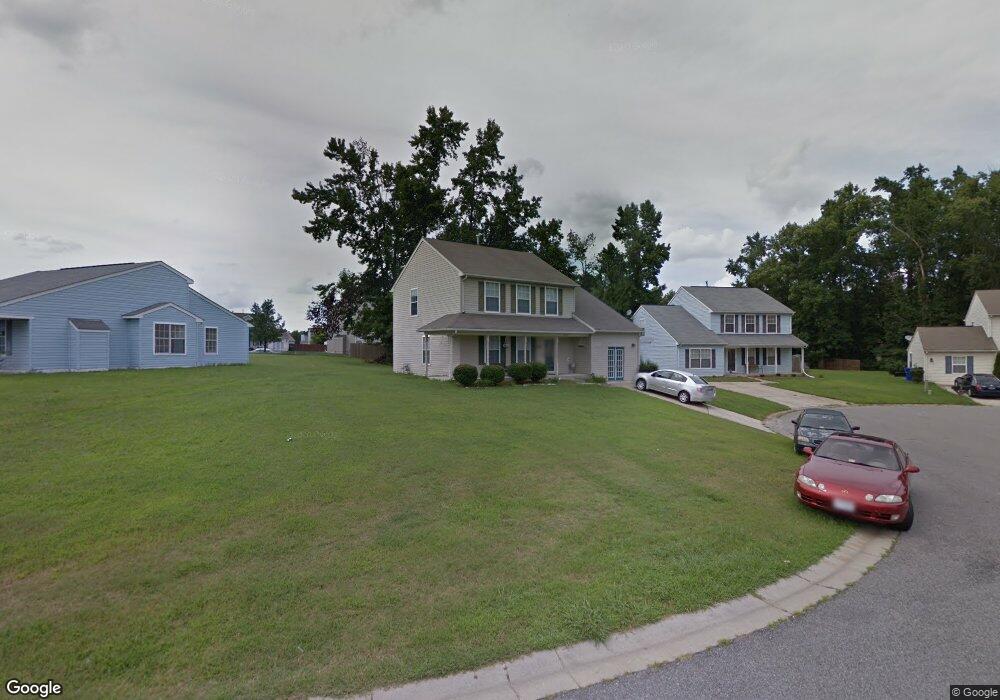
421 Collier Crescent Suffolk, VA 23434
Holy Neck NeighborhoodEstimated Value: $318,000 - $329,000
4
Beds
3
Baths
1,950
Sq Ft
$166/Sq Ft
Est. Value
About This Home
This home is located at 421 Collier Crescent, Suffolk, VA 23434 and is currently estimated at $323,104, approximately $165 per square foot. 421 Collier Crescent is a home located in Suffolk City with nearby schools including Booker T. Washington Elementary School, John F. Kennedy Middle School, and Lakeland High School.
Ownership History
Date
Name
Owned For
Owner Type
Purchase Details
Closed on
Jan 22, 2019
Sold by
Quality Capital Management Llc
Bought by
Worthington Ramone
Current Estimated Value
Home Financials for this Owner
Home Financials are based on the most recent Mortgage that was taken out on this home.
Original Mortgage
$226,227
Outstanding Balance
$198,900
Interest Rate
4.6%
Mortgage Type
VA
Estimated Equity
$124,204
Purchase Details
Closed on
Jul 11, 2018
Sold by
Us Bank Na
Bought by
Quality Capital Management Llc
Home Financials for this Owner
Home Financials are based on the most recent Mortgage that was taken out on this home.
Original Mortgage
$145,000
Interest Rate
4.6%
Mortgage Type
New Conventional
Purchase Details
Closed on
Feb 2, 2018
Sold by
Equity Trustees Llc A Virginia Limited L and Johnson Abigail
Bought by
Us Bank Na Successor Trustee To Bank Of and Bear Stearns Asset Backed Securities I L
Create a Home Valuation Report for This Property
The Home Valuation Report is an in-depth analysis detailing your home's value as well as a comparison with similar homes in the area
Home Values in the Area
Average Home Value in this Area
Purchase History
| Date | Buyer | Sale Price | Title Company |
|---|---|---|---|
| Worthington Ramone | $219,000 | Attorney | |
| Quality Capital Management Llc | $151,000 | Attorney | |
| Us Bank Na Successor Trustee To Bank Of | $140,250 | None Available |
Source: Public Records
Mortgage History
| Date | Status | Borrower | Loan Amount |
|---|---|---|---|
| Open | Worthington Ramone | $226,227 | |
| Previous Owner | Quality Capital Management Llc | $145,000 |
Source: Public Records
Tax History
| Year | Tax Paid | Tax Assessment Tax Assessment Total Assessment is a certain percentage of the fair market value that is determined by local assessors to be the total taxable value of land and additions on the property. | Land | Improvement |
|---|---|---|---|---|
| 2025 | $450 | $288,300 | $55,000 | $233,300 |
| 2024 | $450 | $278,700 | $55,000 | $223,700 |
| 2023 | $3,375 | $260,200 | $50,000 | $210,200 |
| 2022 | $2,504 | $229,700 | $50,000 | $179,700 |
| 2021 | $2,201 | $198,300 | $42,000 | $156,300 |
| 2020 | $1,984 | $178,700 | $42,000 | $136,700 |
| 2019 | $1,930 | $173,900 | $42,000 | $131,900 |
| 2018 | $1,978 | $173,900 | $42,000 | $131,900 |
| 2017 | $1,861 | $173,900 | $42,000 | $131,900 |
| 2016 | $1,756 | $164,100 | $42,000 | $122,100 |
| 2015 | $972 | $164,100 | $42,000 | $122,100 |
| 2014 | $972 | $159,300 | $42,000 | $117,300 |
Source: Public Records
Map
Nearby Homes
- 409 Collier Crescent
- 704 Factory St
- 1320 Baltic St
- 501 Mahlon Ave
- 1204 Woods Edge Cir
- 402 Roy St
- 602 County St Unit B
- 605 County St
- 318 Hunter St
- 305 Pleasant St
- 627 Spruce St
- 307 Baker St
- LOT 76 Bidwell St
- 207 Walnut St
- 210 Maple St
- LOT 2 Maple St
- 1208 White Marsh Rd
- 429 Spruce St
- 805 Adams St
- 114 Lewis Ave
- 419 Collier Crescent
- 423 Collier Crescent
- 504 Oak Grove Ct
- 502 Oak Grove Ct
- 500 Oak Grove Ct
- 432 Collier Crescent
- 425 Collier Crescent
- 436 Collier Crescent
- 434 Collier Crescent
- 506 Oak Grove Ct
- 428 Collier Crescent
- 430 Collier Crescent
- 426 Collier Crescent
- 424 Collier Crescent
- 115 Shepherd St
- 503 Oak Grove Ct
- 113 Shepherd St
- 508 Oak Grove Ct
- 501 Oak Grove Ct
- 505 Oak Grove Ct
Your Personal Tour Guide
Ask me questions while you tour the home.