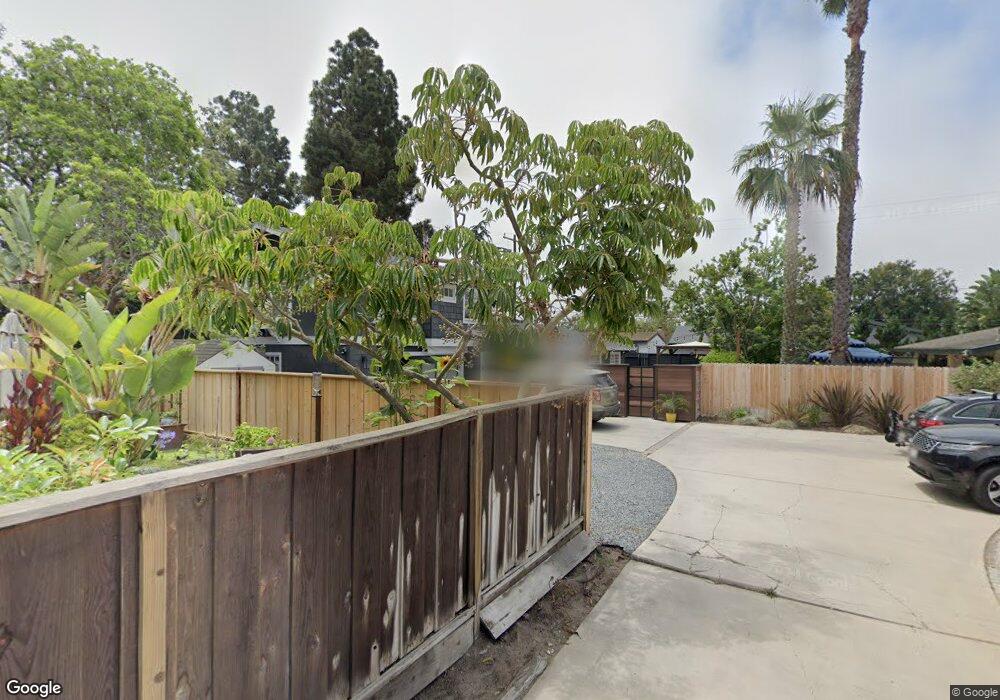
421 E 20th St Costa Mesa, CA 92627
Downtown Costa Mesa NeighborhoodEstimated Value: $1,837,000 - $2,605,351
4
Beds
3
Baths
2,036
Sq Ft
$1,113/Sq Ft
Est. Value
About This Home
This home is located at 421 E 20th St, Costa Mesa, CA 92627 and is currently estimated at $2,266,088, approximately $1,113 per square foot. 421 E 20th St is a home located in Orange County with nearby schools including Woodland Elementary School, Heinz Kaiser Elementary School, and Horace Ensign Intermediate School.
Ownership History
Date
Name
Owned For
Owner Type
Purchase Details
Closed on
Sep 19, 2019
Sold by
Immegart Ryan and Immegart Kimberly
Bought by
Immegard Ryan N and Immegard Kimberly N
Current Estimated Value
Purchase Details
Closed on
Jun 10, 2013
Sold by
Ingalls Christopher W
Bought by
Immegart Ryan and Immegart Kimberly
Home Financials for this Owner
Home Financials are based on the most recent Mortgage that was taken out on this home.
Original Mortgage
$625,500
Interest Rate
3.79%
Mortgage Type
New Conventional
Purchase Details
Closed on
Mar 21, 2012
Sold by
Ingalls Christopher W and Ingalls Karen F
Bought by
Ingalls Christopher W
Home Financials for this Owner
Home Financials are based on the most recent Mortgage that was taken out on this home.
Original Mortgage
$250,000
Interest Rate
3.91%
Mortgage Type
New Conventional
Purchase Details
Closed on
Sep 7, 2002
Sold by
Ingalls Christopher W and Ingalls Karen F
Bought by
Ingalls Christopher W and Ingalls Karen F
Create a Home Valuation Report for This Property
The Home Valuation Report is an in-depth analysis detailing your home's value as well as a comparison with similar homes in the area
Home Values in the Area
Average Home Value in this Area
Purchase History
| Date | Buyer | Sale Price | Title Company |
|---|---|---|---|
| Immegard Ryan N | -- | None Available | |
| Immegart Ryan | $920,000 | Pacific Coast Title Company | |
| Ingalls Christopher W | -- | None Available | |
| Ingalls Christopher W | -- | -- |
Source: Public Records
Mortgage History
| Date | Status | Borrower | Loan Amount |
|---|---|---|---|
| Previous Owner | Immegart Ryan | $625,500 | |
| Previous Owner | Ingalls Christopher W | $250,000 |
Source: Public Records
Tax History
| Year | Tax Paid | Tax Assessment Tax Assessment Total Assessment is a certain percentage of the fair market value that is determined by local assessors to be the total taxable value of land and additions on the property. | Land | Improvement |
|---|---|---|---|---|
| 2025 | $12,990 | $1,127,788 | $921,031 | $206,757 |
| 2024 | $12,990 | $1,105,675 | $902,972 | $202,703 |
| 2023 | $12,546 | $1,083,996 | $885,267 | $198,729 |
| 2022 | $12,070 | $1,062,742 | $867,909 | $194,833 |
| 2021 | $11,676 | $1,041,904 | $850,891 | $191,013 |
| 2020 | $11,550 | $1,031,221 | $842,166 | $189,055 |
| 2019 | $11,306 | $1,011,001 | $825,652 | $185,349 |
| 2018 | $11,080 | $991,178 | $809,463 | $181,715 |
| 2017 | $10,890 | $971,744 | $793,592 | $178,152 |
| 2016 | $10,653 | $952,691 | $778,032 | $174,659 |
| 2015 | $10,553 | $938,381 | $766,345 | $172,036 |
| 2014 | $10,310 | $920,000 | $751,333 | $168,667 |
Source: Public Records
Map
Nearby Homes
- 1935 Tustin Ave
- 379 Walnut St
- 2038 Aliso Ave
- 1717 Irvine Ave
- 412 Magnolia St
- 1800 Tradewinds Ln
- 2206 Francisco Dr
- 1801 Beryl Ln
- 1725 Skylark Ln
- 1938 Westminster Ave
- 2437 Windward Ln
- 1173 Winslow Ln
- 1423 Mariners Dr
- 308 E 18th St
- 2127 Cresta Dr
- 2100 Windward Ln
- 212 E 19th St
- 268 E 18th St
- 1700 Highland Dr
- 2019 Orange Ave
- 421 E 20th St Unit D
- 421 E 20th St Unit C
- 421 E 20th St
- 421 E 20th St
- 421 E 20th St
- 425 E 20th St
- 417 E 20th St
- 413 E 20th St
- 429 E 20th St
- 431 E 20th St
- 418 E 20th St
- 424 E 20th St
- 410 E 20th St
- 430 E 20th St
- 1998 Tustin Ave
- 1992 Tustin Ave
- 437 E 20th St
- 1986 Tustin Ave
- 421 Woodland Place
- 406 E 20th St
Your Personal Tour Guide
Ask me questions while you tour the home.