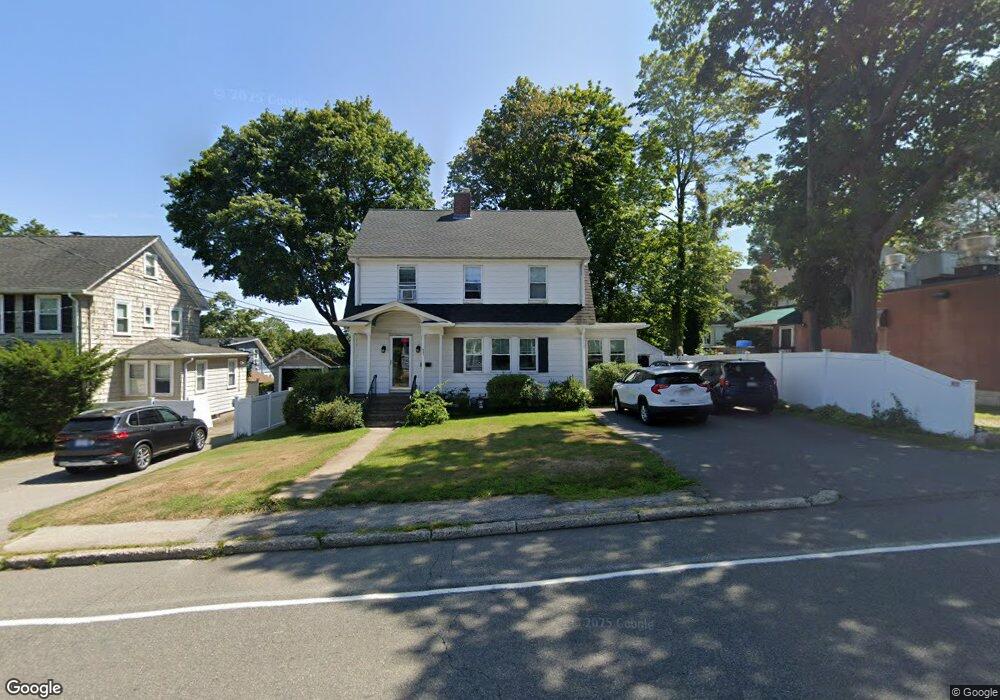
421 Elm St Braintree, MA 02184
East Braintree NeighborhoodEstimated Value: $594,000 - $761,000
3
Beds
2
Baths
2,098
Sq Ft
$326/Sq Ft
Est. Value
About This Home
This home is located at 421 Elm St, Braintree, MA 02184 and is currently estimated at $684,311, approximately $326 per square foot. 421 Elm St is a home located in Norfolk County with nearby schools including Braintree High School, Step Ahead Kindergarten, and Meeting House Montessori School.
Ownership History
Date
Name
Owned For
Owner Type
Purchase Details
Closed on
Feb 28, 2003
Sold by
Ann H Kimball T and Kimball Ann H
Bought by
Stec Carol A and Stec Gregory
Current Estimated Value
Home Financials for this Owner
Home Financials are based on the most recent Mortgage that was taken out on this home.
Original Mortgage
$228,000
Outstanding Balance
$98,732
Interest Rate
5.98%
Mortgage Type
Purchase Money Mortgage
Estimated Equity
$585,579
Create a Home Valuation Report for This Property
The Home Valuation Report is an in-depth analysis detailing your home's value as well as a comparison with similar homes in the area
Home Values in the Area
Average Home Value in this Area
Purchase History
| Date | Buyer | Sale Price | Title Company |
|---|---|---|---|
| Stec Carol A | $285,000 | -- |
Source: Public Records
Mortgage History
| Date | Status | Borrower | Loan Amount |
|---|---|---|---|
| Open | Stec Carol A | $228,000 |
Source: Public Records
Tax History
| Year | Tax Paid | Tax Assessment Tax Assessment Total Assessment is a certain percentage of the fair market value that is determined by local assessors to be the total taxable value of land and additions on the property. | Land | Improvement |
|---|---|---|---|---|
| 2025 | $5,199 | $520,900 | $284,000 | $236,900 |
| 2024 | $4,658 | $491,400 | $262,500 | $228,900 |
| 2023 | $4,466 | $457,600 | $241,000 | $216,600 |
| 2022 | $4,716 | $474,000 | $223,800 | $250,200 |
| 2021 | $4,403 | $442,500 | $206,500 | $236,000 |
| 2020 | $4,363 | $442,500 | $206,500 | $236,000 |
| 2019 | $4,203 | $416,600 | $206,500 | $210,100 |
| 2018 | $3,847 | $365,000 | $163,500 | $201,500 |
| 2017 | $3,644 | $339,300 | $146,300 | $193,000 |
| 2016 | $3,446 | $313,800 | $129,100 | $184,700 |
| 2015 | $3,338 | $301,500 | $123,900 | $177,600 |
| 2014 | $3,297 | $288,700 | $123,900 | $164,800 |
Source: Public Records
Map
Nearby Homes
- 342 Elm St
- 255 River St
- 17 White Rd
- 20 Vine St
- 26 Tingley Rd
- 300 Commercial St Unit 23
- 50 Cleveland Ave
- 14 Hillside Rd
- 30 Skyline Dr Unit 6
- 599 Union St
- 9 Independence Ave Unit 307
- 37 Skyline Dr Unit 11
- 312 Shaw St
- 36 Chestnut Ave
- 192 Federal Ave Unit B
- 25 W Howard St Unit C3
- 99 Verchild St
- 63 Dickerman Ln
- 469-471 Washington St
- 155 Kendrick Ave Unit 502
Your Personal Tour Guide
Ask me questions while you tour the home.