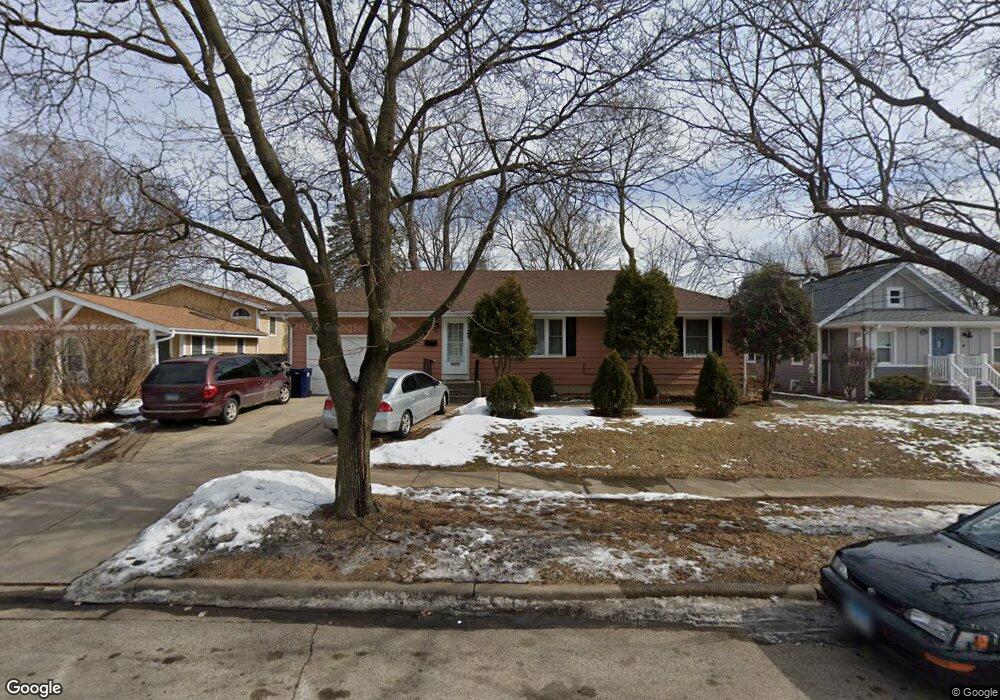
421 George St Elgin, IL 60120
Southeast Elgin NeighborhoodEstimated Value: $205,000 - $286,000
3
Beds
2
Baths
1,120
Sq Ft
$225/Sq Ft
Est. Value
About This Home
This home is located at 421 George St, Elgin, IL 60120 and is currently estimated at $252,236, approximately $225 per square foot. 421 George St is a home located in Kane County with nearby schools including Huff Elementary School, Ellis Middle School, and Elgin High School.
Ownership History
Date
Name
Owned For
Owner Type
Purchase Details
Closed on
Nov 30, 2001
Sold by
Lugo Juan and Lozano Teresa
Bought by
Medrano Ernestino and Medrano Maria Julia
Current Estimated Value
Home Financials for this Owner
Home Financials are based on the most recent Mortgage that was taken out on this home.
Original Mortgage
$131,929
Outstanding Balance
$51,973
Interest Rate
6.68%
Mortgage Type
FHA
Estimated Equity
$200,264
Purchase Details
Closed on
Mar 5, 1999
Sold by
Thiele Dennis L
Bought by
Lugo Juan and Lozano Teresa
Home Financials for this Owner
Home Financials are based on the most recent Mortgage that was taken out on this home.
Original Mortgage
$109,554
Interest Rate
6.78%
Mortgage Type
FHA
Create a Home Valuation Report for This Property
The Home Valuation Report is an in-depth analysis detailing your home's value as well as a comparison with similar homes in the area
Home Values in the Area
Average Home Value in this Area
Purchase History
| Date | Buyer | Sale Price | Title Company |
|---|---|---|---|
| Medrano Ernestino | $134,000 | -- | |
| Lugo Juan | $111,000 | -- |
Source: Public Records
Mortgage History
| Date | Status | Borrower | Loan Amount |
|---|---|---|---|
| Open | Medrano Ernestino | $131,929 | |
| Previous Owner | Lugo Juan | $109,554 |
Source: Public Records
Tax History
| Year | Tax Paid | Tax Assessment Tax Assessment Total Assessment is a certain percentage of the fair market value that is determined by local assessors to be the total taxable value of land and additions on the property. | Land | Improvement |
|---|---|---|---|---|
| 2024 | $5,139 | $72,211 | $17,721 | $54,490 |
| 2023 | $4,879 | $65,238 | $16,010 | $49,228 |
| 2022 | $4,638 | $59,485 | $14,598 | $44,887 |
| 2021 | $4,426 | $55,614 | $13,648 | $41,966 |
| 2020 | $4,121 | $51,184 | $13,029 | $38,155 |
| 2019 | $3,993 | $48,756 | $12,411 | $36,345 |
| 2018 | $3,529 | $41,692 | $11,692 | $30,000 |
| 2017 | $3,437 | $39,414 | $11,053 | $28,361 |
| 2016 | $3,260 | $36,565 | $10,254 | $26,311 |
| 2015 | -- | $33,515 | $9,399 | $24,116 |
| 2014 | -- | $33,101 | $9,283 | $23,818 |
| 2013 | -- | $38,288 | $9,528 | $28,760 |
Source: Public Records
Map
Nearby Homes
- 689 Bent St
- 513 Cookane Ave
- 631 Bent St
- 457 Arlington Ave
- 445 Lucile Ave
- 450 Villa St
- 483 Barrett St
- 332-334 St Charles St
- 518 Raymond St
- 262 Bartlett Place
- 286 Villa St
- 385 Woodview Cir Unit B
- 277 Gifford Place
- 833 Forest Ave
- 330 Buckingham Cir Unit C
- 115 N Porter St
- 149 Highbury Dr
- 7 National St Unit 7
- 3 National St Unit 3
- 211 Prairie St
Your Personal Tour Guide
Ask me questions while you tour the home.