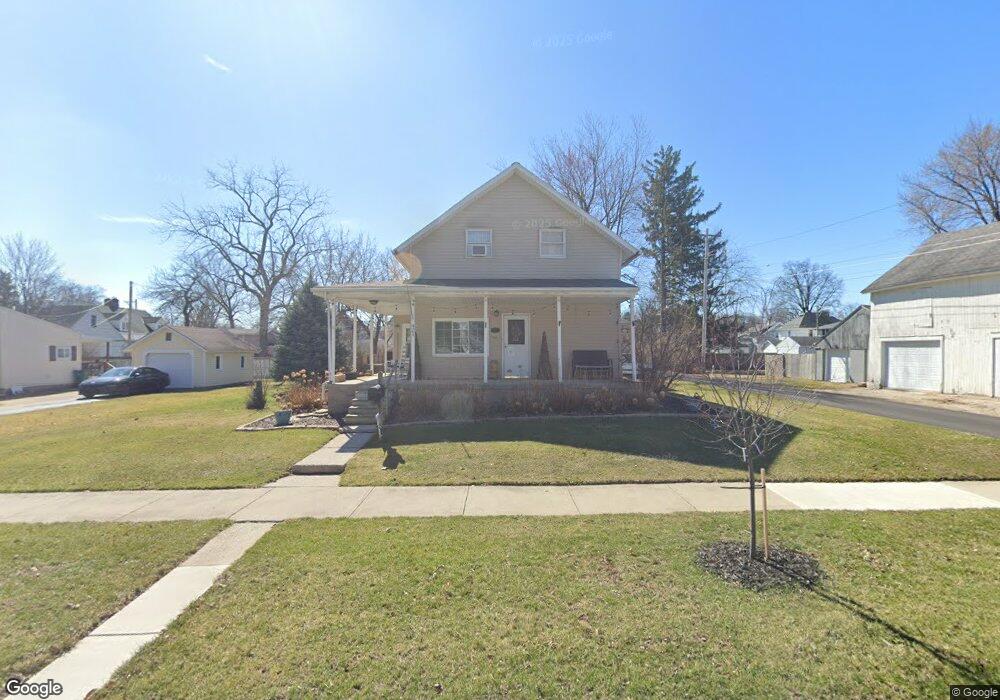
421 Hancock St Findlay, OH 45840
Estimated Value: $203,000 - $235,000
3
Beds
2
Baths
1,560
Sq Ft
$139/Sq Ft
Est. Value
About This Home
This home is located at 421 Hancock St, Findlay, OH 45840 and is currently estimated at $217,198, approximately $139 per square foot. 421 Hancock St is a home located in Hancock County with nearby schools including Lincoln Elementary School, Donnell Middle School, and Findlay High School.
Ownership History
Date
Name
Owned For
Owner Type
Purchase Details
Closed on
Sep 30, 1997
Sold by
Kramer Richard
Bought by
Nenni John and Nenni Janice
Current Estimated Value
Home Financials for this Owner
Home Financials are based on the most recent Mortgage that was taken out on this home.
Original Mortgage
$80,250
Outstanding Balance
$13,097
Interest Rate
7.63%
Mortgage Type
New Conventional
Estimated Equity
$204,101
Create a Home Valuation Report for This Property
The Home Valuation Report is an in-depth analysis detailing your home's value as well as a comparison with similar homes in the area
Home Values in the Area
Average Home Value in this Area
Purchase History
| Date | Buyer | Sale Price | Title Company |
|---|---|---|---|
| Nenni John | $84,500 | -- |
Source: Public Records
Mortgage History
| Date | Status | Borrower | Loan Amount |
|---|---|---|---|
| Open | Nenni John | $80,250 |
Source: Public Records
Tax History Compared to Growth
Tax History
| Year | Tax Paid | Tax Assessment Tax Assessment Total Assessment is a certain percentage of the fair market value that is determined by local assessors to be the total taxable value of land and additions on the property. | Land | Improvement |
|---|---|---|---|---|
| 2024 | $1,585 | $54,420 | $7,280 | $47,140 |
| 2023 | $1,610 | $54,420 | $7,280 | $47,140 |
| 2022 | $1,619 | $54,420 | $7,280 | $47,140 |
| 2021 | $1,183 | $37,810 | $7,280 | $30,530 |
| 2020 | $1,183 | $37,810 | $7,280 | $30,530 |
| 2019 | $1,508 | $37,810 | $7,280 | $30,530 |
| 2018 | $1,452 | $33,360 | $6,620 | $26,740 |
| 2017 | $1,451 | $33,360 | $6,620 | $26,740 |
| 2016 | $1,436 | $33,360 | $6,620 | $26,740 |
| 2015 | $1,402 | $32,060 | $6,620 | $25,440 |
| 2014 | $1,402 | $32,060 | $6,620 | $25,440 |
| 2012 | $1,461 | $33,120 | $6,620 | $26,500 |
Source: Public Records
Map
Nearby Homes