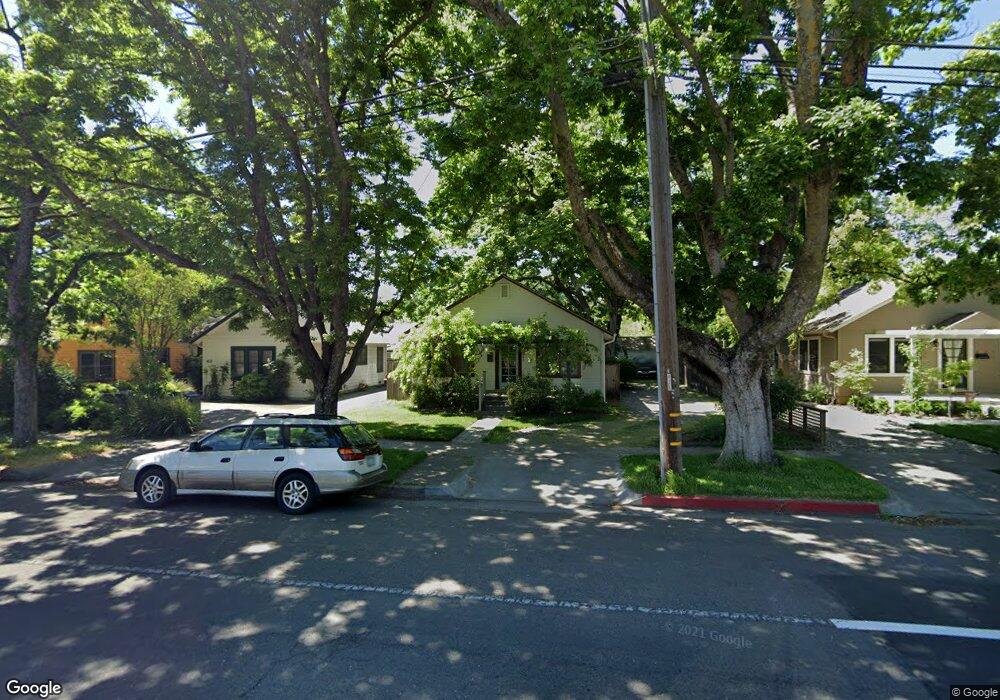
421 J St Davis, CA 95616
Downtown Davis NeighborhoodEstimated Value: $662,000 - $822,000
2
Beds
1
Bath
1,040
Sq Ft
$700/Sq Ft
Est. Value
About This Home
This home is located at 421 J St, Davis, CA 95616 and is currently estimated at $728,417, approximately $700 per square foot. 421 J St is a home located in Yolo County with nearby schools including North Davis Elementary School, Oliver Wendell Holmes Junior High School, and Davis Senior High School.
Ownership History
Date
Name
Owned For
Owner Type
Purchase Details
Closed on
Sep 23, 2011
Sold by
Jones Valerie
Bought by
Alexander Matthew and Alexander Tracy
Current Estimated Value
Home Financials for this Owner
Home Financials are based on the most recent Mortgage that was taken out on this home.
Original Mortgage
$442,491
Outstanding Balance
$300,543
Interest Rate
4.09%
Mortgage Type
FHA
Estimated Equity
$427,874
Purchase Details
Closed on
Jul 7, 2003
Sold by
Moffett Russell E and Moffett Illa
Bought by
Jones Valerie
Home Financials for this Owner
Home Financials are based on the most recent Mortgage that was taken out on this home.
Original Mortgage
$109,000
Interest Rate
4%
Mortgage Type
Purchase Money Mortgage
Purchase Details
Closed on
Feb 11, 2003
Sold by
Moffett Illa
Bought by
Moffett Russell E and Moffett Illa
Purchase Details
Closed on
Dec 23, 2002
Sold by
Moffett Illa
Bought by
Moffett Illa
Create a Home Valuation Report for This Property
The Home Valuation Report is an in-depth analysis detailing your home's value as well as a comparison with similar homes in the area
Home Values in the Area
Average Home Value in this Area
Purchase History
| Date | Buyer | Sale Price | Title Company |
|---|---|---|---|
| Alexander Matthew | $454,000 | Placer Title Company | |
| Jones Valerie | $273,000 | Placer Title | |
| Moffett Russell E | -- | -- | |
| Moffett Illa | -- | -- |
Source: Public Records
Mortgage History
| Date | Status | Borrower | Loan Amount |
|---|---|---|---|
| Open | Alexander Matthew | $442,491 | |
| Previous Owner | Jones Valerie | $109,000 |
Source: Public Records
Tax History
| Year | Tax Paid | Tax Assessment Tax Assessment Total Assessment is a certain percentage of the fair market value that is determined by local assessors to be the total taxable value of land and additions on the property. | Land | Improvement |
|---|---|---|---|---|
| 2025 | $7,590 | $570,238 | $314,008 | $256,230 |
| 2023 | $7,590 | $548,096 | $301,815 | $246,281 |
| 2022 | $7,273 | $537,350 | $295,898 | $241,452 |
| 2021 | $7,103 | $526,815 | $290,097 | $236,718 |
| 2020 | $6,990 | $521,414 | $287,123 | $234,291 |
| 2019 | $6,674 | $511,192 | $281,494 | $229,698 |
| 2018 | $6,216 | $501,170 | $275,975 | $225,195 |
| 2017 | $6,086 | $491,344 | $270,564 | $220,780 |
| 2016 | $5,902 | $481,710 | $265,259 | $216,451 |
| 2015 | $5,699 | $474,475 | $261,275 | $213,200 |
| 2014 | $5,699 | $465,181 | $256,157 | $209,024 |
Source: Public Records
Map
Nearby Homes
Your Personal Tour Guide
Ask me questions while you tour the home.