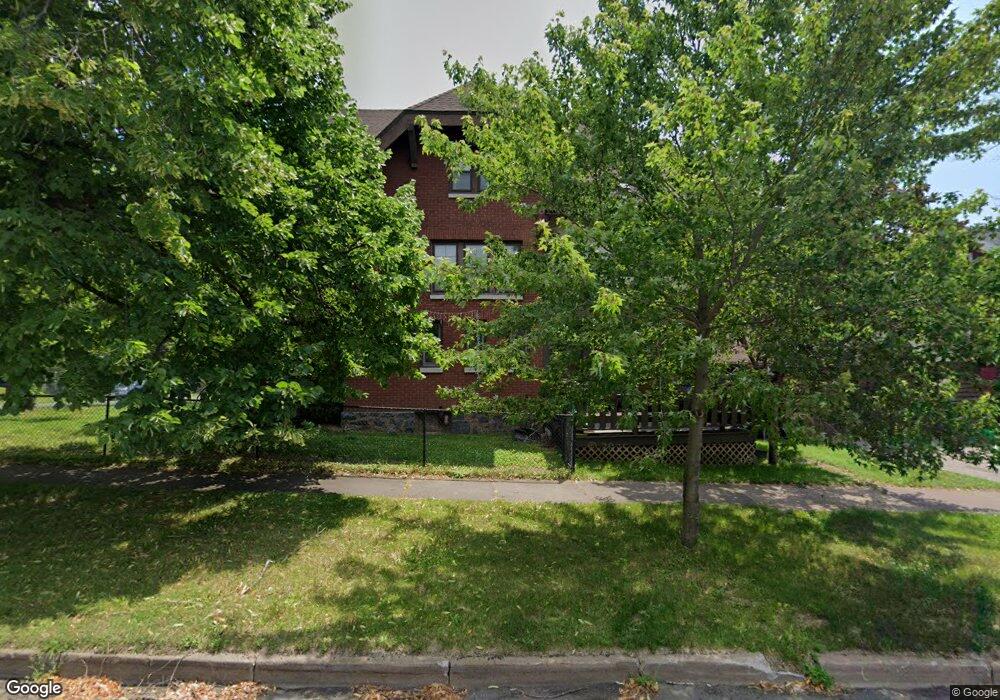
421 N 23rd Ave E Duluth, MN 55812
Chester Park NeighborhoodEstimated Value: $678,000 - $749,415
8
Beds
4
Baths
3,787
Sq Ft
$185/Sq Ft
Est. Value
About This Home
This home is located at 421 N 23rd Ave E, Duluth, MN 55812 and is currently estimated at $700,604, approximately $185 per square foot. 421 N 23rd Ave E is a home located in St. Louis County with nearby schools including Congdon Elementary School, Ordean East Middle School, and East High School.
Ownership History
Date
Name
Owned For
Owner Type
Purchase Details
Closed on
May 30, 2007
Sold by
Fannie Mae
Bought by
Meints Glenn and Meints Trisha
Current Estimated Value
Home Financials for this Owner
Home Financials are based on the most recent Mortgage that was taken out on this home.
Original Mortgage
$304,000
Interest Rate
6.22%
Mortgage Type
Purchase Money Mortgage
Purchase Details
Closed on
Aug 24, 2006
Sold by
Kang Maryan and Kang Sun H
Bought by
Mortgage Electronic Registration Systems
Purchase Details
Closed on
Mar 1, 2002
Sold by
Day Thomas W and Day Christine M
Bought by
Kang Sun H and Kang Maryan
Home Financials for this Owner
Home Financials are based on the most recent Mortgage that was taken out on this home.
Original Mortgage
$210,000
Interest Rate
7.03%
Create a Home Valuation Report for This Property
The Home Valuation Report is an in-depth analysis detailing your home's value as well as a comparison with similar homes in the area
Home Values in the Area
Average Home Value in this Area
Purchase History
| Date | Buyer | Sale Price | Title Company |
|---|---|---|---|
| Meints Glenn | -- | Multiple | |
| Meints Glenn | -- | Consolidated Title | |
| Mortgage Electronic Registration Systems | $220,036 | None Available | |
| Kang Sun H | $299,000 | Arrowhead Abstract & Title C | |
| Kang Sun H | $299,000 | Arrowhead Abstract & Title C |
Source: Public Records
Mortgage History
| Date | Status | Borrower | Loan Amount |
|---|---|---|---|
| Previous Owner | Meints Glenn | $304,000 | |
| Previous Owner | Kang Sun H | $210,000 |
Source: Public Records
Tax History
| Year | Tax Paid | Tax Assessment Tax Assessment Total Assessment is a certain percentage of the fair market value that is determined by local assessors to be the total taxable value of land and additions on the property. | Land | Improvement |
|---|---|---|---|---|
| 2024 | $8,554 | $602,000 | $49,900 | $552,100 |
| 2023 | $8,554 | $584,200 | $49,200 | $535,000 |
| 2022 | $8,518 | $514,900 | $43,700 | $471,200 |
| 2021 | $6,930 | $426,300 | $35,700 | $390,600 |
| 2020 | $7,074 | $429,500 | $35,700 | $393,800 |
| 2019 | $6,894 | $426,100 | $32,300 | $393,800 |
| 2018 | $6,448 | $418,400 | $32,300 | $386,100 |
| 2017 | $5,888 | $418,400 | $32,300 | $386,100 |
| 2016 | $5,742 | $217,400 | $37,300 | $180,100 |
| 2015 | $5,688 | $370,100 | $39,300 | $330,800 |
| 2014 | $5,688 | $370,100 | $39,300 | $330,800 |
Source: Public Records
Map
Nearby Homes
- 2123 E 4th St
- 2328 E 3rd St
- xxx E 2nd St
- 2415 E 2nd St
- 619 Woodland Ave
- 625 Woodland Ave
- 2101 E 1st St
- 627 N 20th Ave E
- 721 N 20th Ave E
- 1914 E 1st St
- 2510 E Superior St
- 629 N 19th Ave E
- 2610 E 8th St
- 2514 E Superior St
- 16 S 25th Ave E
- 2501 Branch St
- 1801 E 4th St
- 1905 E Superior St
- 1901 E Superior St
- 1723 E 4th St
Your Personal Tour Guide
Ask me questions while you tour the home.