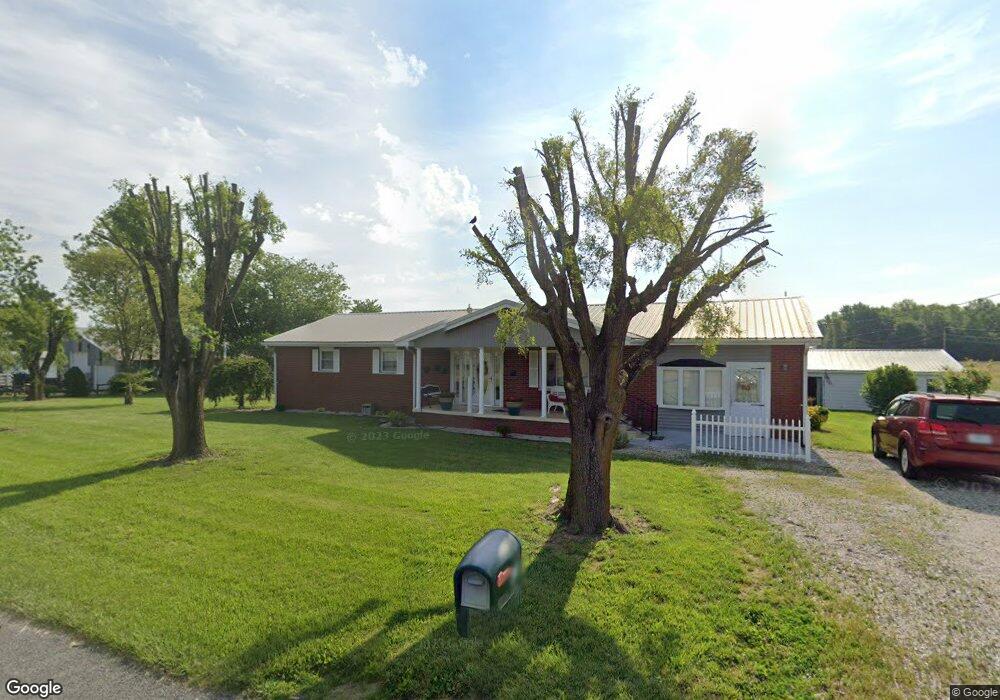
421 N Main St Campbellsburg, IN 47108
Estimated Value: $263,000
3
Beds
2
Baths
1,768
Sq Ft
$149/Sq Ft
Est. Value
About This Home
This home is located at 421 N Main St, Campbellsburg, IN 47108 and is currently estimated at $263,000, approximately $148 per square foot. 421 N Main St is a home located in Washington County with nearby schools including West Washington Elementary School and West Washington Junior/Senior High School.
Ownership History
Date
Name
Owned For
Owner Type
Purchase Details
Closed on
Jul 7, 2023
Sold by
Johnson Wayne L and Johnson Beverly
Bought by
Johnson Kyle Wayne
Current Estimated Value
Purchase Details
Closed on
Jun 26, 2023
Sold by
Johnson Wayne L and Johnson Beverly J
Bought by
Johnson Wayne L and Johnson Beverly J
Purchase Details
Closed on
Jul 21, 2020
Sold by
Johnson Wayne L and Johnson Beverly
Bought by
Johnson Duke Eli
Create a Home Valuation Report for This Property
The Home Valuation Report is an in-depth analysis detailing your home's value as well as a comparison with similar homes in the area
Home Values in the Area
Average Home Value in this Area
Purchase History
| Date | Buyer | Sale Price | Title Company |
|---|---|---|---|
| Johnson Kyle Wayne | -- | None Listed On Document | |
| Johnson Wayne L | -- | None Listed On Document | |
| Johnson Duke Eli | -- | None Available |
Source: Public Records
Tax History Compared to Growth
Tax History
| Year | Tax Paid | Tax Assessment Tax Assessment Total Assessment is a certain percentage of the fair market value that is determined by local assessors to be the total taxable value of land and additions on the property. | Land | Improvement |
|---|---|---|---|---|
| 2024 | $531 | $30,400 | $30,400 | $0 |
| 2023 | $1,551 | $181,200 | $56,100 | $125,100 |
| 2022 | $1,473 | $176,100 | $48,700 | $127,400 |
| 2021 | $1,375 | $164,300 | $44,800 | $119,500 |
| 2020 | $1,404 | $166,500 | $44,700 | $121,800 |
| 2019 | $1,539 | $176,600 | $49,800 | $126,800 |
| 2018 | $1,656 | $170,300 | $44,400 | $125,900 |
| 2017 | $1,582 | $176,300 | $48,900 | $127,400 |
| 2016 | $1,561 | $183,800 | $51,100 | $132,700 |
| 2014 | $1,848 | $202,600 | $55,400 | $147,200 |
| 2013 | $1,903 | $198,700 | $50,300 | $148,400 |
Source: Public Records
Map
Nearby Homes
- 6253 N Marshall Rd
- 225 W Oak St
- 140 S Sycamore St
- 237 E Oak St
- 71 S Beech St
- 4882 N Hunter Rd
- 282 Wyler Ln
- 8261 W Cox Ferry Rd
- 0 N White River Rd
- 000 E Side N White River Rd
- 7879 N Co Road 475 E
- TBD Starr Rd
- N White River Rd
- 843 Earl Rd
- 4879 W Henderson Park Rd
- 0 N Starr Rd
- 4946 W Arrow Rd
- 602 Noe Rd
- TBD W Sparksville Rd
- 0 W Sparksville Rd Unit 23590004
- 401 N Main St
- 4832 N Saltillo Bono Rd
- 204 N East St
- 135 N Main St
- 280 W North St
- 99 N East St
- 114 N Main St
- 360 W North St
- 10644 W Nicholson Rd
- 147 W North St
- 147 W North St
- 291 E North St
- 315 W North St
- 10641 W Nicholson Rd
- 90 N West St
- 65 N Main St
- 60 N Main St
- 81 N East St
- 60 N East St
- 12 N Main St