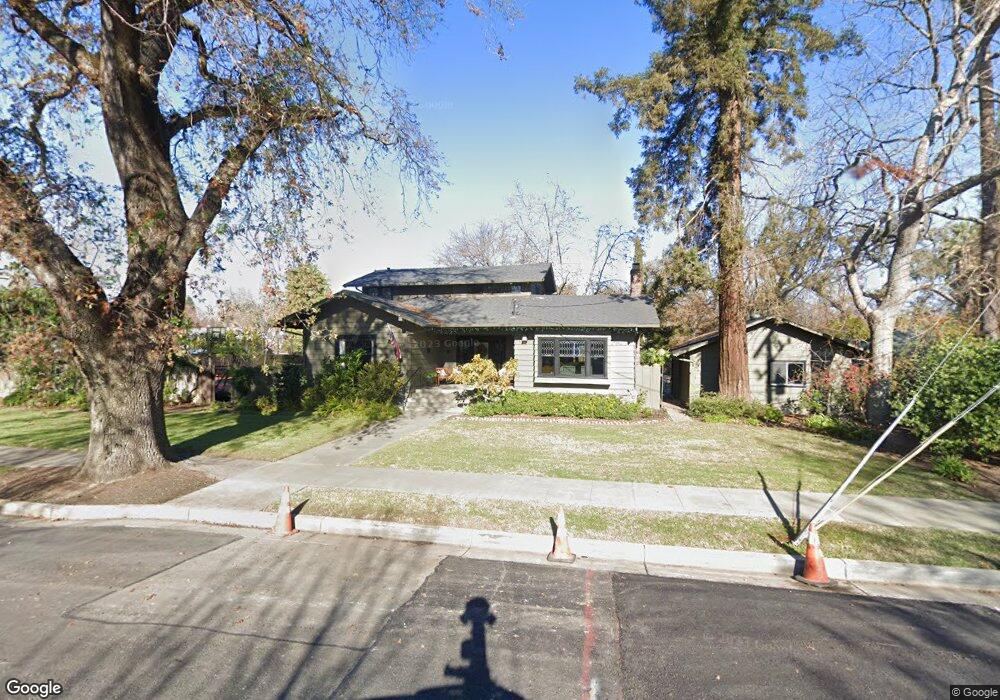
421 Pendegast St Woodland, CA 95695
Estimated Value: $597,000 - $832,000
3
Beds
2
Baths
2,400
Sq Ft
$293/Sq Ft
Est. Value
About This Home
This home is located at 421 Pendegast St, Woodland, CA 95695 and is currently estimated at $703,345, approximately $293 per square foot. 421 Pendegast St is a home located in Yolo County with nearby schools including Dingle Elementary School, Lee Middle School, and Woodland Senior High School.
Ownership History
Date
Name
Owned For
Owner Type
Purchase Details
Closed on
Nov 19, 2021
Sold by
Monley Patrick C and Monley Elizabeth M
Bought by
Monley Patrick C and Monley Elizabeth M
Current Estimated Value
Purchase Details
Closed on
May 7, 2009
Sold by
Monley Patrick C and Monley Elizabeth M
Bought by
Monley Patrick C and Monley Elizabeth M
Purchase Details
Closed on
Jul 27, 1998
Sold by
Leiser G Malcolm & Janice Tr
Bought by
Monley Patrick C and Monley Elizabeth M
Home Financials for this Owner
Home Financials are based on the most recent Mortgage that was taken out on this home.
Original Mortgage
$118,650
Outstanding Balance
$24,710
Interest Rate
6.9%
Estimated Equity
$678,635
Purchase Details
Closed on
May 19, 1995
Sold by
Leiser G Malcolm and Leiser Janice
Bought by
Leiser G Malcolm and Leiser Janice L
Create a Home Valuation Report for This Property
The Home Valuation Report is an in-depth analysis detailing your home's value as well as a comparison with similar homes in the area
Home Values in the Area
Average Home Value in this Area
Purchase History
| Date | Buyer | Sale Price | Title Company |
|---|---|---|---|
| Monley Patrick C | -- | None Available | |
| Monley Patrick C | -- | None Available | |
| Monley Patrick C | -- | None Available | |
| Monley Patrick C | $372,500 | Placer Title Company | |
| Leiser G Malcolm | -- | -- |
Source: Public Records
Mortgage History
| Date | Status | Borrower | Loan Amount |
|---|---|---|---|
| Open | Monley Patrick C | $118,650 |
Source: Public Records
Tax History Compared to Growth
Tax History
| Year | Tax Paid | Tax Assessment Tax Assessment Total Assessment is a certain percentage of the fair market value that is determined by local assessors to be the total taxable value of land and additions on the property. | Land | Improvement |
|---|---|---|---|---|
| 2025 | $5,069 | $498,838 | $94,049 | $404,789 |
| 2023 | $5,069 | $479,469 | $90,398 | $389,071 |
| 2022 | $4,868 | $470,069 | $88,626 | $381,443 |
| 2021 | $4,788 | $460,853 | $86,889 | $373,964 |
| 2020 | $4,720 | $456,129 | $85,999 | $370,130 |
| 2019 | $4,630 | $447,186 | $84,313 | $362,873 |
| 2018 | $4,581 | $438,418 | $82,660 | $355,758 |
| 2017 | $4,480 | $429,823 | $81,040 | $348,783 |
| 2016 | $4,393 | $420,457 | $79,451 | $341,006 |
| 2015 | $4,243 | $414,142 | $78,258 | $335,884 |
| 2014 | $4,243 | $406,031 | $76,726 | $329,305 |
Source: Public Records
Map
Nearby Homes