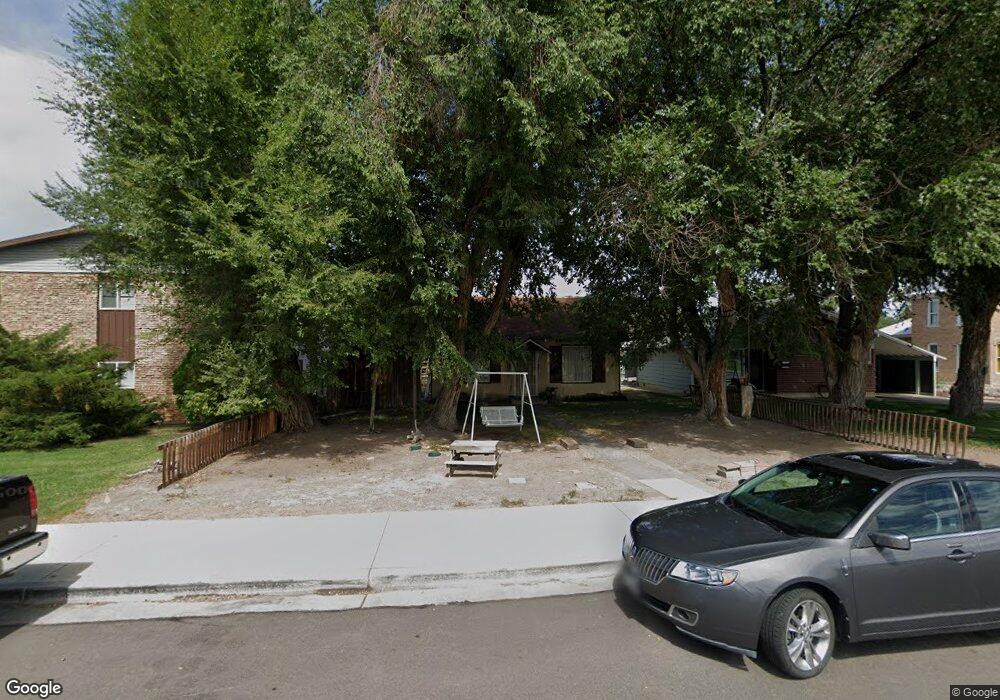
421 S 9th St Montrose, CO 81401
Estimated Value: $206,000 - $279,000
2
Beds
1
Bath
672
Sq Ft
$344/Sq Ft
Est. Value
About This Home
This home is located at 421 S 9th St, Montrose, CO 81401 and is currently estimated at $231,020, approximately $343 per square foot. 421 S 9th St is a home located in Montrose County with nearby schools including Pomona Elementary School, Centennial Middle School, and Montrose High School.
Ownership History
Date
Name
Owned For
Owner Type
Purchase Details
Closed on
Jan 11, 2024
Sold by
Albanes Faye M
Bought by
Albanese Faye M and Varbel Leseley M
Current Estimated Value
Purchase Details
Closed on
Dec 21, 2023
Sold by
Chotvacs Maybelle
Bought by
Chotvacs Wade and Chotvacs Andy
Purchase Details
Closed on
Aug 4, 2005
Sold by
Albanese David J
Bought by
Chotvacs Maybelle
Purchase Details
Closed on
Mar 29, 2005
Sold by
Albanese Faye Marie
Bought by
Albanese David J
Purchase Details
Closed on
Feb 14, 1994
Sold by
Schoonover Earl L
Bought by
Albanese David J and Albanese Faye Marie
Purchase Details
Closed on
Sep 10, 1991
Sold by
Strakbein Richard L and Strakbein Nancy J
Bought by
Schoonover Earl L and Schoonover Alice
Purchase Details
Closed on
Sep 5, 1979
Sold by
Lewis Lawrence L and Lewis Gail S
Bought by
Strakbein Richard L and Strakbein Nancy J
Create a Home Valuation Report for This Property
The Home Valuation Report is an in-depth analysis detailing your home's value as well as a comparison with similar homes in the area
Home Values in the Area
Average Home Value in this Area
Purchase History
| Date | Buyer | Sale Price | Title Company |
|---|---|---|---|
| Albanese Faye M | -- | None Listed On Document | |
| Chotvacs Wade | -- | None Listed On Document | |
| Chotvacs Maybelle | $80,000 | Security Title | |
| Albanese David J | -- | None Available | |
| Albanese David J | $55,000 | -- | |
| Schoonover Earl L | $26,000 | -- | |
| Strakbein Richard L | $28,000 | -- |
Source: Public Records
Tax History Compared to Growth
Tax History
| Year | Tax Paid | Tax Assessment Tax Assessment Total Assessment is a certain percentage of the fair market value that is determined by local assessors to be the total taxable value of land and additions on the property. | Land | Improvement |
|---|---|---|---|---|
| 2024 | $523 | $7,340 | $2,450 | $4,890 |
| 2023 | $523 | $11,440 | $3,820 | $7,620 |
| 2022 | $542 | $7,880 | $2,780 | $5,100 |
| 2021 | $558 | $8,100 | $2,860 | $5,240 |
| 2020 | $461 | $6,870 | $2,470 | $4,400 |
| 2019 | $464 | $6,870 | $2,470 | $4,400 |
| 2018 | $367 | $5,300 | $1,990 | $3,310 |
| 2017 | $364 | $5,300 | $1,990 | $3,310 |
| 2016 | $354 | $5,240 | $2,010 | $3,230 |
| 2015 | $348 | $5,240 | $2,010 | $3,230 |
| 2014 | $321 | $5,180 | $2,010 | $3,170 |
Source: Public Records
Map
Nearby Homes
- 535 S 11th St Unit 5
- 902 S Mesa Ave
- 612 & 616 S 6th
- 85 Colorado Ave
- 801 S Nevada Ave
- 814 S 7th St
- 103 Duncan Place
- TBD S 4th St
- 9 Aspen St
- 909 S 10th St
- 23 S 5th St
- 122 Spruce Dr
- 119 Akard Ave
- 1413 Chatam Dr
- TBD Montrose Dr Site C
- 825 S 1st St
- 147 E Main St Unit 147 Main , 18 N Se
- 1205 Dover Rd
- 1128 Highland Dr
- 1131 S 12th St
- S Ninth St
- 435 S 9th St
- 447 S 9th St
- 420 S 8th St
- 430 S 8th St
- 841 S Cascade Ave
- 410 S 8th St
- 438 S 8th St
- 800 S Uncompahgre Ave
- 1426 Fivemile Creek Ave
- 1422 Fivemile Creek Ave
- 501 S 9th St
- 806 S Cascade Ave
- 803 S Uncompahgre Ave
- 802 S Cascade Ave
- 505 S 9th St
- 335 S 9th St
- S S Cascade Ave Unit Corner Cascade and S
- S S Cascade Ave
- S S Cascade Ave Unit 1869 East Main