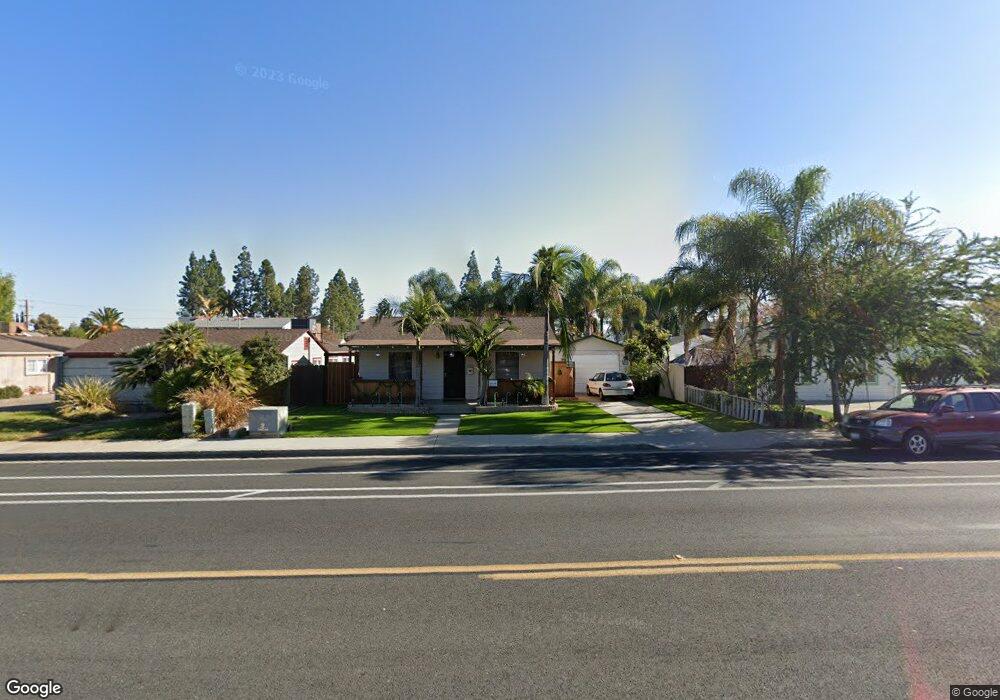
421 S Magnolia Ave El Cajon, CA 92020
Estimated Value: $600,000 - $649,840
2
Beds
1
Bath
841
Sq Ft
$739/Sq Ft
Est. Value
About This Home
This home is located at 421 S Magnolia Ave, El Cajon, CA 92020 and is currently estimated at $621,460, approximately $738 per square foot. 421 S Magnolia Ave is a home located in San Diego County with nearby schools including Johnson Elementary School, Cajon Valley Middle School, and Grossmont High School.
Ownership History
Date
Name
Owned For
Owner Type
Purchase Details
Closed on
May 21, 2011
Sold by
Sanchez Livier R
Bought by
Sanchez Liver Rodriguez and Sanchez Livier R
Current Estimated Value
Purchase Details
Closed on
Jun 14, 2005
Sold by
Beason Chris C
Bought by
Sanchez Livier Rodriguez
Home Financials for this Owner
Home Financials are based on the most recent Mortgage that was taken out on this home.
Original Mortgage
$308,000
Outstanding Balance
$110,391
Interest Rate
1%
Mortgage Type
Unknown
Estimated Equity
$511,069
Purchase Details
Closed on
Jan 4, 2005
Sold by
Beason Deborah Lee
Bought by
Beason Chris C
Purchase Details
Closed on
Mar 19, 2004
Sold by
Conaway C Dan and Thacher Penne L
Bought by
Burger Andy J and Giles Burger Deborah
Home Financials for this Owner
Home Financials are based on the most recent Mortgage that was taken out on this home.
Original Mortgage
$196,000
Interest Rate
4.75%
Mortgage Type
Unknown
Create a Home Valuation Report for This Property
The Home Valuation Report is an in-depth analysis detailing your home's value as well as a comparison with similar homes in the area
Home Values in the Area
Average Home Value in this Area
Purchase History
| Date | Buyer | Sale Price | Title Company |
|---|---|---|---|
| Sanchez Liver Rodriguez | -- | None Available | |
| Sanchez Livier Rodriguez | $385,000 | First American Title | |
| Beason Chris C | -- | Landamerica Commercial Svcs | |
| Burger Andy J | $280,000 | Commonwealth Land Title Co |
Source: Public Records
Mortgage History
| Date | Status | Borrower | Loan Amount |
|---|---|---|---|
| Open | Sanchez Livier Rodriguez | $308,000 | |
| Previous Owner | Burger Andy J | $196,000 |
Source: Public Records
Tax History Compared to Growth
Tax History
| Year | Tax Paid | Tax Assessment Tax Assessment Total Assessment is a certain percentage of the fair market value that is determined by local assessors to be the total taxable value of land and additions on the property. | Land | Improvement |
|---|---|---|---|---|
| 2025 | $6,463 | $526,117 | $355,303 | $170,814 |
| 2024 | $6,463 | $515,802 | $348,337 | $167,465 |
| 2023 | $6,381 | $505,689 | $341,507 | $164,182 |
| 2022 | $6,664 | $495,774 | $334,811 | $160,963 |
| 2021 | $7,967 | $486,054 | $328,247 | $157,807 |
| 2020 | $7,036 | $481,071 | $324,882 | $156,189 |
| 2019 | $6,485 | $471,639 | $318,512 | $153,127 |
| 2018 | $5,592 | $462,392 | $312,267 | $150,125 |
| 2017 | $5,579 | $453,327 | $306,145 | $147,182 |
| 2016 | $5,298 | $444,440 | $300,143 | $144,297 |
| 2015 | $5,270 | $437,765 | $295,635 | $142,130 |
| 2014 | -- | $429,190 | $289,844 | $139,346 |
Source: Public Records
Map
Nearby Homes
- 652 S Orange Ave
- 0 Rea Ave
- 403 Emerald Ave Unit 8
- 188 S Lincoln Ave Unit 22
- Plan 1448 Modeled at Gateway
- Plan 1709 Modeled at Gateway
- 525 Sandstone Ct
- 160 Chambers St Unit 15
- 520 Cobblestone Ct
- 511 Cobblestone Ct
- 540 Cobblestone Ct
- 370 Gateway Dr
- 471 S Lincoln Ave
- 272 Indiana Ave
- 351 Connecticut Ave
- 180 Chambers St Unit 4
- 538 S Johnson Ave
- 908 S Sunshine Ave Unit 18
- 373 Connecticut Ave
- 294 Chambers St Unit 45
- 413 S Magnolia Ave
- 437 S Magnolia Ave Unit 39
- 411 S Magnolia Ave
- 445 S Magnolia Ave Unit 47
- 405 S Magnolia Ave
- 440 Highland Ave
- 402 Highland Ave Unit 10
- 357 S Magnolia Ave
- 440 S Magnolia Ave Unit 42
- 416 416 S Magnolia Ave
- 416 S Magnolia Ave
- 416-20 416-20 S Magnolia Ave
- 416-20 S Magnolia Ave
- 436 S Magnolia Ave
- 448 S Magnolia Ave
- 150 W Camden Ave
- 349 S Magnolia Ave
- 334 Highland Ave Unit 36
- 502 Camden Yards Way
- 350 S Magnolia Ave