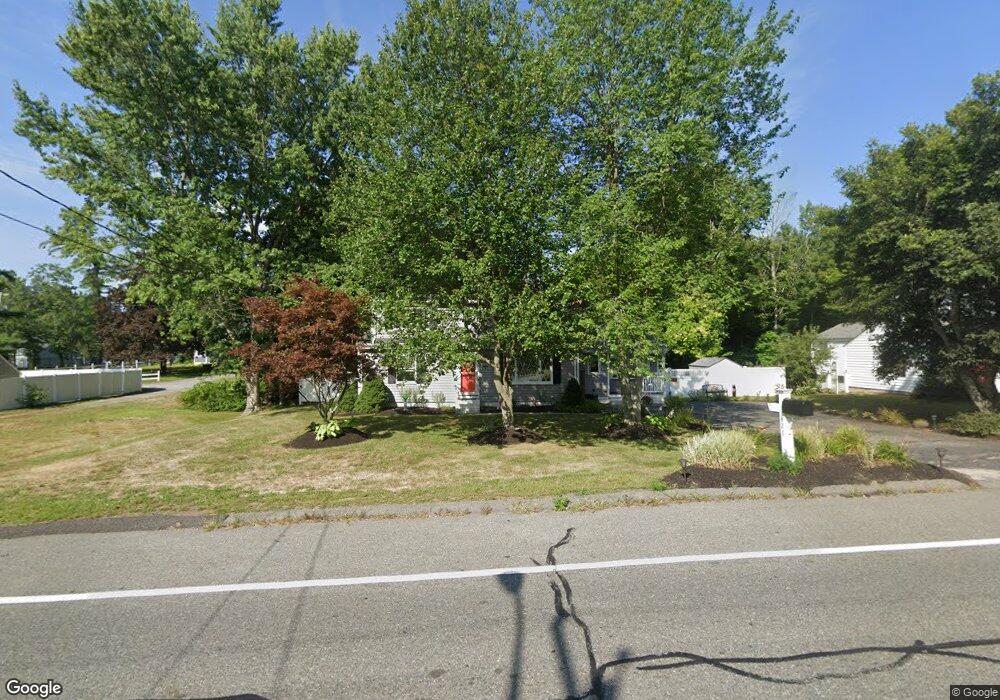
421 S Main St Andover, MA 01810
Estimated Value: $739,000 - $878,000
4
Beds
2
Baths
1,857
Sq Ft
$428/Sq Ft
Est. Value
About This Home
This home is located at 421 S Main St, Andover, MA 01810 and is currently estimated at $794,137, approximately $427 per square foot. 421 S Main St is a home located in Essex County with nearby schools including South Elementary School, Doherty Middle School, and Andover High School.
Ownership History
Date
Name
Owned For
Owner Type
Purchase Details
Closed on
Dec 21, 2010
Sold by
Ayers Michele
Bought by
Dellapaolera John D and Dellapaolera Joan C
Current Estimated Value
Home Financials for this Owner
Home Financials are based on the most recent Mortgage that was taken out on this home.
Original Mortgage
$291,080
Outstanding Balance
$190,150
Interest Rate
4.23%
Mortgage Type
Purchase Money Mortgage
Estimated Equity
$603,987
Purchase Details
Closed on
Jun 27, 2008
Sold by
Obrien Nancy
Bought by
Ayers Michele
Home Financials for this Owner
Home Financials are based on the most recent Mortgage that was taken out on this home.
Original Mortgage
$352,915
Interest Rate
6.07%
Mortgage Type
Purchase Money Mortgage
Purchase Details
Closed on
Nov 15, 2002
Sold by
Mcgregor Cynthia and Mcgregor Barry
Bought by
Obrien Nancy E
Purchase Details
Closed on
Aug 25, 1995
Sold by
Zaremba Stanley A
Bought by
Mcgregor Barry
Create a Home Valuation Report for This Property
The Home Valuation Report is an in-depth analysis detailing your home's value as well as a comparison with similar homes in the area
Purchase History
| Date | Buyer | Sale Price | Title Company |
|---|---|---|---|
| Dellapaolera John D | $295,000 | -- | |
| Dellapaolera John D | $295,000 | -- | |
| Ayers Michele | $366,000 | -- | |
| Ayers Michele | $366,000 | -- | |
| Obrien Nancy E | $360,000 | -- | |
| Obrien Nancy E | $360,000 | -- | |
| Mcgregor Barry | $160,000 | -- | |
| Mcgregor Barry | $160,000 | -- |
Source: Public Records
Mortgage History
| Date | Status | Borrower | Loan Amount |
|---|---|---|---|
| Open | Dellapaolera John D | $291,080 | |
| Closed | Mcgregor Barry | $291,080 | |
| Previous Owner | Ayers Michele | $352,915 |
Source: Public Records
Tax History
| Year | Tax Paid | Tax Assessment Tax Assessment Total Assessment is a certain percentage of the fair market value that is determined by local assessors to be the total taxable value of land and additions on the property. | Land | Improvement |
|---|---|---|---|---|
| 2024 | $8,380 | $650,600 | $366,600 | $284,000 |
| 2023 | $8,129 | $595,100 | $339,400 | $255,700 |
| 2022 | $7,598 | $520,400 | $287,500 | $232,900 |
| 2021 | $7,260 | $474,800 | $261,400 | $213,400 |
| 2020 | $6,960 | $463,700 | $255,000 | $208,700 |
| 2019 | $6,884 | $450,800 | $247,600 | $203,200 |
| 2018 | $6,567 | $419,900 | $233,500 | $186,400 |
| 2017 | $6,285 | $414,000 | $228,900 | $185,100 |
| 2016 | $6,137 | $414,100 | $228,900 | $185,200 |
| 2015 | $5,907 | $394,600 | $220,100 | $174,500 |
Source: Public Records
Map
Nearby Homes
- 23 Belknap Dr
- 3 Regency Ridge
- 344 S Main St
- 56 Sunset Rock Rd
- 11 Wyncrest Cir
- 3 West Hollow
- 133B Salem
- 4 Hammond Way
- 16 Porter Rd
- 47 Harold Parker Rd
- 31 Porter Rd
- 57 Salem St
- 11 Cogswell Rd
- 49 Salem St
- 52 Salem St
- 18 Dale St Unit 9D
- 12 B Chester Rd Unit D
- 12D Chester Rd
- 12 Parkview Terrace
- 3 Pinecrest Rd
- 419 S Main St
- 425 S Main St
- 5 Rattlesnake Hill Rd
- 415 S Main St
- 422 S Main St
- 7 Rattlesnake Hill Rd
- 420 S Main St
- 413 S Main St
- 4 Rocky Hill Rd
- 6 Rattlesnake Hill Rd
- 12 Lavender Hill Ln
- 10 Lavender Hill Ln
- 430 S Main St
- 411 S Main St
- 16 Rattlesnake Hill Rd
- 8 Lavender Hill Ln
- 3 Rocky Hill Rd
- 409 S Main St
- 416 S Main St
- 432 S Main St
Your Personal Tour Guide
Ask me questions while you tour the home.