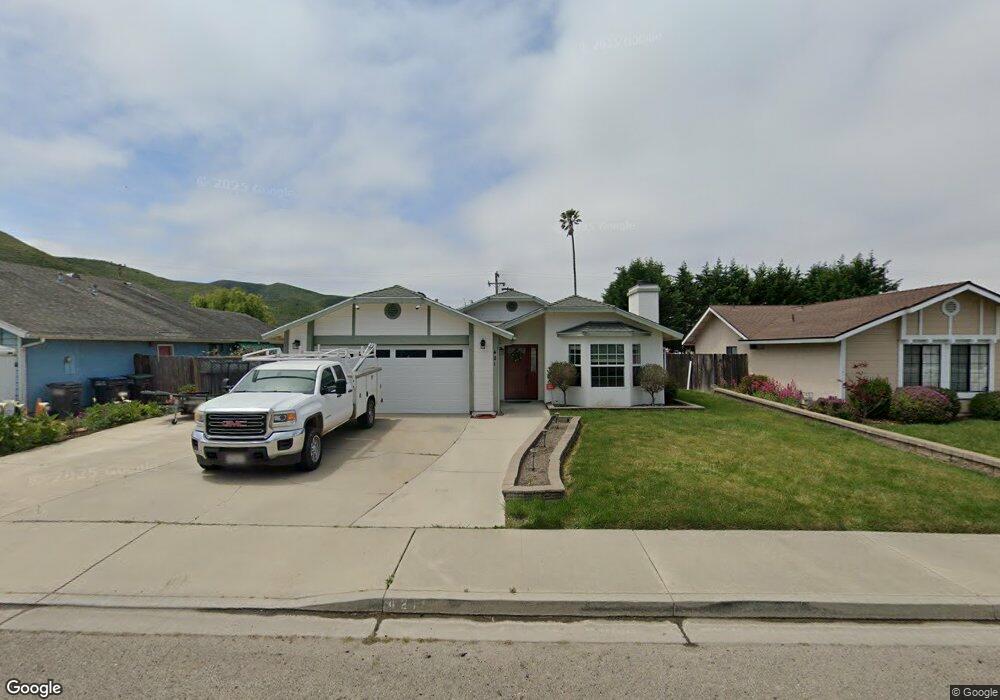
421 S Sage St Lompoc, CA 93436
West Lompoc NeighborhoodEstimated Value: $548,000 - $599,986
3
Beds
2
Baths
1,512
Sq Ft
$385/Sq Ft
Est. Value
About This Home
This home is located at 421 S Sage St, Lompoc, CA 93436 and is currently estimated at $581,497, approximately $384 per square foot. 421 S Sage St is a home located in Santa Barbara County with nearby schools including Miguelito Elementary School, Lompoc Valley Middle School, and Lompoc High School.
Ownership History
Date
Name
Owned For
Owner Type
Purchase Details
Closed on
May 11, 2023
Sold by
Westerfield Constance Grace
Bought by
Westerfield Family Trust
Current Estimated Value
Purchase Details
Closed on
Nov 6, 2009
Sold by
Westerfield Frank W and Westerfield Constance Grace
Bought by
Westerfield Constance Grace
Purchase Details
Closed on
Jan 17, 2007
Sold by
Sisson Connie G
Bought by
Westerfield Frank William and Sisson Connie G
Purchase Details
Closed on
Oct 19, 2004
Sold by
Barbosa Lawrence and Barbosa Jenifer S
Bought by
Sisson Connie G
Home Financials for this Owner
Home Financials are based on the most recent Mortgage that was taken out on this home.
Original Mortgage
$332,000
Interest Rate
6.75%
Mortgage Type
Purchase Money Mortgage
Purchase Details
Closed on
Oct 7, 2002
Sold by
Figueroa Gregorio G and Figueroa Felipa
Bought by
Barbosa Lawrence and Barbosa Jenifer S
Home Financials for this Owner
Home Financials are based on the most recent Mortgage that was taken out on this home.
Original Mortgage
$208,000
Interest Rate
6.09%
Purchase Details
Closed on
Apr 11, 2001
Sold by
Costa Jayson P and Costa Marnae S
Bought by
Barbosa Lawrence and Barbosa Jennifer S
Home Financials for this Owner
Home Financials are based on the most recent Mortgage that was taken out on this home.
Original Mortgage
$198,737
Interest Rate
6.98%
Mortgage Type
FHA
Purchase Details
Closed on
Sep 7, 1999
Sold by
Hills Lee T and Lee Janie
Bought by
Costa Jayson P and Costa Marnae S
Home Financials for this Owner
Home Financials are based on the most recent Mortgage that was taken out on this home.
Original Mortgage
$153,000
Interest Rate
7.97%
Mortgage Type
VA
Create a Home Valuation Report for This Property
The Home Valuation Report is an in-depth analysis detailing your home's value as well as a comparison with similar homes in the area
Home Values in the Area
Average Home Value in this Area
Purchase History
| Date | Buyer | Sale Price | Title Company |
|---|---|---|---|
| Westerfield Family Trust | -- | None Listed On Document | |
| Westerfield Constance Grace | -- | None Available | |
| Westerfield Frank William | -- | None Available | |
| Sisson Connie G | $415,000 | First American Title Company | |
| Barbosa Lawrence | -- | First American Title | |
| Barbosa Lawrence | $202,000 | First American Title | |
| Costa Jayson P | $150,000 | Chicago Title Co |
Source: Public Records
Mortgage History
| Date | Status | Borrower | Loan Amount |
|---|---|---|---|
| Previous Owner | Sisson Connie G | $332,000 | |
| Previous Owner | Barbosa Lawrence | $208,000 | |
| Previous Owner | Barbosa Lawrence | $198,737 | |
| Previous Owner | Costa Jayson P | $153,000 | |
| Closed | Sisson Connie G | $62,250 |
Source: Public Records
Tax History Compared to Growth
Tax History
| Year | Tax Paid | Tax Assessment Tax Assessment Total Assessment is a certain percentage of the fair market value that is determined by local assessors to be the total taxable value of land and additions on the property. | Land | Improvement |
|---|---|---|---|---|
| 2025 | $5,757 | $553,000 | $164,000 | $389,000 |
| 2023 | $5,757 | $478,000 | $142,000 | $336,000 |
| 2022 | $5,233 | $468,000 | $139,000 | $329,000 |
| 2021 | $4,689 | $407,000 | $121,000 | $286,000 |
| 2020 | $4,258 | $370,000 | $110,000 | $260,000 |
| 2019 | $4,271 | $370,000 | $110,000 | $260,000 |
| 2018 | $4,049 | $349,500 | $100,000 | $249,500 |
| 2017 | $3,123 | $270,000 | $122,000 | $148,000 |
| 2016 | $2,834 | $245,000 | $111,000 | $134,000 |
| 2014 | $2,371 | $203,000 | $92,000 | $111,000 |
Source: Public Records
Map
Nearby Homes
- 401 S R St
- 1328 W Willow Ave
- 413 S O Place
- 1105 W Cypress Ave Unit J
- 1213 W Cypress Ave Unit D
- 1317 W Cypress Ave Unit A2
- 428 S Z St
- 23 Village Circle Dr
- 309 N V St
- 328 N X St
- 1426 Plum Ave
- 135 N J St
- 137 N J St
- 300 W Walnut Ave
- 500 N Z St
- 6 Santa Clara Dr
- 531 N O St
- 1212 W Prune Ave
- 122 N G St
- 612 University Dr