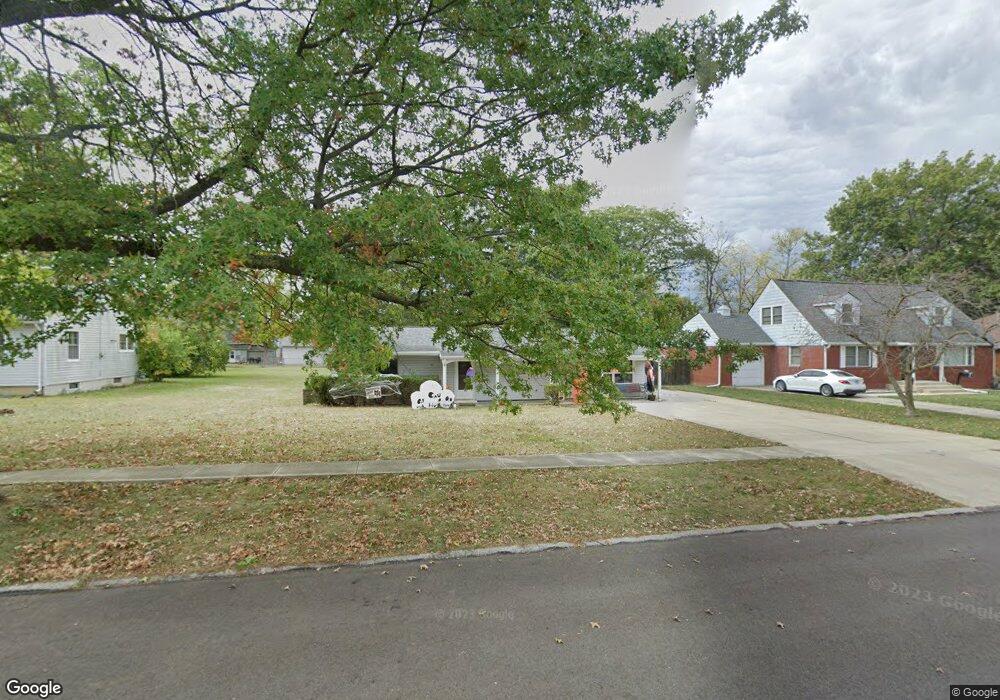
421 S Seffner Ave Marion, OH 43302
Estimated Value: $240,395
3
Beds
1
Bath
1,456
Sq Ft
$165/Sq Ft
Est. Value
About This Home
This home is located at 421 S Seffner Ave, Marion, OH 43302 and is currently estimated at $240,395, approximately $165 per square foot. 421 S Seffner Ave is a home located in Marion County with nearby schools including George Washington Elementary School, Ulysses S. Grant Middle School, and Harding High School.
Ownership History
Date
Name
Owned For
Owner Type
Purchase Details
Closed on
Jun 16, 2025
Sold by
Northland Homes And Properties Inc
Bought by
Summit Housing Development Corporation
Current Estimated Value
Home Financials for this Owner
Home Financials are based on the most recent Mortgage that was taken out on this home.
Original Mortgage
$0
Interest Rate
6.81%
Purchase Details
Closed on
Sep 24, 2008
Sold by
Fox Michael E and Fox Patrice Ann
Bought by
Northland Homes & Properties Inc
Home Financials for this Owner
Home Financials are based on the most recent Mortgage that was taken out on this home.
Original Mortgage
$19,028
Interest Rate
6.52%
Mortgage Type
Commercial
Create a Home Valuation Report for This Property
The Home Valuation Report is an in-depth analysis detailing your home's value as well as a comparison with similar homes in the area
Home Values in the Area
Average Home Value in this Area
Purchase History
We collect this data history from publicly available records. To have your information removed, we recommend requesting removal directly through your county’s website.
| Date | Buyer | Sale Price | Title Company |
|---|---|---|---|
| Summit Housing Development Corporation | -- | None Listed On Document | |
| Summit Housing Development Corporation | -- | None Listed On Document | |
| Northland Homes & Properties Inc | $110,000 | Eagle Title Llc |
Source: Public Records
Mortgage History
We collect this data history from publicly available records. To have your information removed, we recommend requesting removal directly through your county’s website.
| Date | Status | Borrower | Loan Amount |
|---|---|---|---|
| Closed | Summit Housing Development Corporation | $0 | |
| Open | Summit Housing Development Corporation | $1,775,360 | |
| Closed | Summit Housing Development Corporation | $1,775,360 | |
| Previous Owner | Northland Homes & Properties Inc | $19,028 |
Source: Public Records
Tax History
| Year | Tax Paid | Tax Assessment Tax Assessment Total Assessment is a certain percentage of the fair market value that is determined by local assessors to be the total taxable value of land and additions on the property. | Land | Improvement |
|---|---|---|---|---|
| 2025 | $2 | $67,110 | $9,060 | $58,050 |
| 2024 | $2 | $43,250 | $7,610 | $35,640 |
| 2023 | $2 | $43,250 | $7,610 | $35,640 |
| 2022 | $2 | $43,250 | $7,610 | $35,640 |
| 2021 | $2 | $37,540 | $7,610 | $29,930 |
| 2020 | $2 | $37,540 | $7,610 | $29,930 |
| 2019 | $2 | $37,540 | $7,610 | $29,930 |
| 2018 | $2 | $34,290 | $7,250 | $27,040 |
| 2017 | $31 | $34,290 | $7,250 | $27,040 |
| 2016 | $2 | $34,290 | $7,250 | $27,040 |
| 2015 | $2 | $33,770 | $7,250 | $26,520 |
| 2014 | $2 | $33,770 | $7,250 | $26,520 |
| 2012 | $1,455 | $36,170 | $10,060 | $26,110 |
Source: Public Records
Map
Nearby Homes
- 333 S Seffner Ave
- 479 Uhler Ave
- 885 Mount Vernon Ave
- 310 Hane Ave
- 929 Mount Vernon Ave
- 437 Forest Lawn Blvd
- 492 Forest Lawn Blvd
- 222 Uhler Ave
- 667 King Ave
- 223 Forest Lawn Blvd
- 714 E Church St
- 692 Uhler Rd
- 183 Chicago Ave
- 1145 E Church St
- 523 Normandy Dr
- 164 Clover Ave
- 250 N Grand Ave
- 819 Laura Dr
- 1175 E Church St
- 868 Leetonia Rd
- 413 S Seffner Ave
- 435 S Seffner Ave
- 409 S Seffner Ave
- 421 S Seffner [P]
- 406 S Grand Ave
- 426 S Grand Ave
- 405 S Seffner Ave
- 432 S Grand Ave
- 418 S Grand Ave
- 412 S Grand Ave
- 422 S Seffner Ave
- 412 S Seffner Ave
- 430 S Seffner Ave
- 401 S Seffner Ave
- 400 S Grand Ave
- 440 S Seffner Ave
- 404 S Seffner Ave
- 810 Mount Vernon Ave
- 440 S Grand Ave
- 816 Mount Vernon Ave
Your Personal Tour Guide
Ask me questions while you tour the home.