Estimated Value: $276,868 - $284,000
3
Beds
2
Baths
1,529
Sq Ft
$184/Sq Ft
Est. Value
About This Home
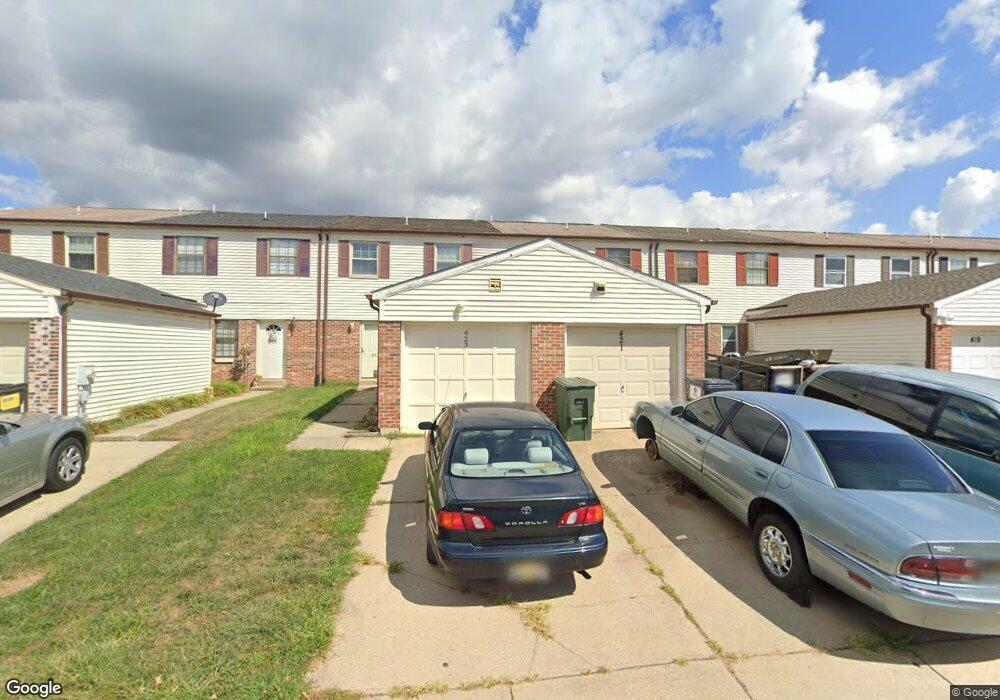
This home is located at 421 Shai Cir, Bear, DE 19701 and is currently estimated at $280,967, approximately $183 per square foot. 421 Shai Cir is a home located in New Castle County with nearby schools including Henry M. Brader Elementary School, Gauger-Cobbs Middle School, and Glasgow High School.
Ownership History
Date
Name
Owned For
Owner Type
Purchase Details
Closed on
Jul 29, 2025
Sold by
Sheriff Of New Castle County
Bought by
Troy Realty Llc
Current Estimated Value
Purchase Details
Closed on
Oct 20, 2008
Sold by
Bell Anthony
Bought by
Bell Anthony and Bell Hedley I
Home Financials for this Owner
Home Financials are based on the most recent Mortgage that was taken out on this home.
Original Mortgage
$164,326
Interest Rate
6.08%
Mortgage Type
FHA
Purchase Details
Closed on
Apr 22, 2003
Sold by
Meyer William J C and Meyer Wilbert G
Bought by
Bell Anthony
Home Financials for this Owner
Home Financials are based on the most recent Mortgage that was taken out on this home.
Original Mortgage
$116,900
Interest Rate
5.82%
Mortgage Type
FHA
Create a Home Valuation Report for This Property
The Home Valuation Report is an in-depth analysis detailing your home's value as well as a comparison with similar homes in the area
Home Values in the Area
Average Home Value in this Area
Purchase History
| Date | Buyer | Sale Price | Title Company |
|---|---|---|---|
| Troy Realty Llc | $168,000 | None Listed On Document | |
| Bell Anthony | -- | Genuine Title Llc | |
| Bell Anthony | $117,900 | -- |
Source: Public Records
Mortgage History
| Date | Status | Borrower | Loan Amount |
|---|---|---|---|
| Previous Owner | Bell Anthony | $164,326 | |
| Previous Owner | Bell Anthony | $116,900 |
Source: Public Records
Tax History
| Year | Tax Paid | Tax Assessment Tax Assessment Total Assessment is a certain percentage of the fair market value that is determined by local assessors to be the total taxable value of land and additions on the property. | Land | Improvement |
|---|---|---|---|---|
| 2024 | $4,327 | $54,100 | $7,100 | $47,000 |
| 2023 | $4,515 | $54,100 | $7,100 | $47,000 |
| 2022 | $2,299 | $54,100 | $7,100 | $47,000 |
| 2021 | $2,250 | $54,100 | $7,100 | $47,000 |
| 2020 | $2,188 | $54,100 | $7,100 | $47,000 |
| 2019 | $2,107 | $54,100 | $7,100 | $47,000 |
| 2018 | $2,217 | $54,100 | $7,100 | $47,000 |
| 2017 | $1,832 | $54,100 | $7,100 | $47,000 |
| 2016 | $1,818 | $54,100 | $7,100 | $47,000 |
| 2015 | $1,662 | $54,100 | $7,100 | $47,000 |
| 2014 | $1,663 | $54,100 | $7,100 | $47,000 |
Source: Public Records
Map
Nearby Homes
- 222 Springwood Dr
- 204 Springwood Dr
- 2664 Glasgow Ave
- 152 W Savannah Dr
- 121 Devalinder Dr
- 18 Devalinder Dr
- 557 Mansion House Rd
- 137 Hammersmith Way
- 38 Stardust Dr
- 421 S Antlers Place
- 411 Pheasant Cir
- 48 Marble House Dr
- 204 Skeet Cir W
- 52 Eaton Place
- 15 Eaton Place
- 9 Coralberry Dr
- 95 Hempstead Dr
- 45 Longleaf Ln
- 228 Jasmine Ln
- 2 Pegasus Place
Your Personal Tour Guide
Ask me questions while you tour the home.