
Seller's Agent in 2015
Jamie Bennington
Wilson Realtors, West Union
(937) 205-2060
8 in this area
28 Total Sales
Estimated Value: $96,000 - $143,264
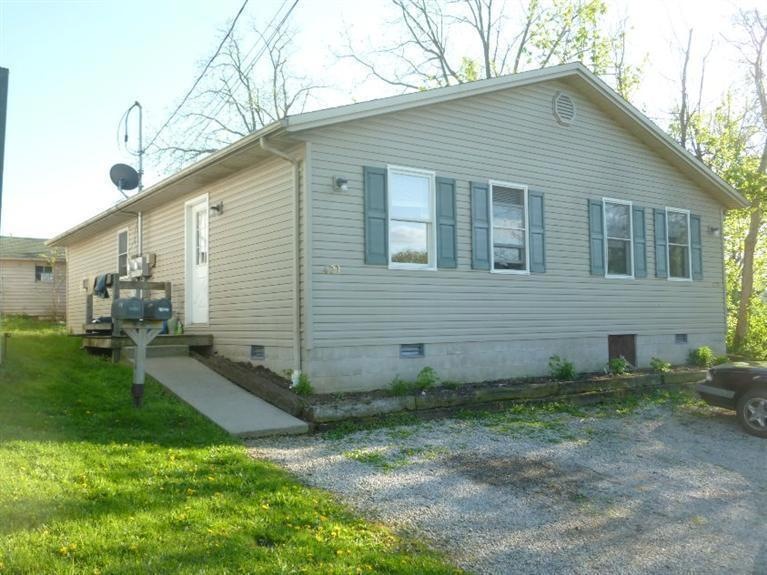
Turn-key duplex with no repairs needed. Two bedroom units with washer and dryer hook ups, separate circuit panels, water heaters, thermostats, open kitchen and living room floor plan, minimal lawn maintenance. Motivated Sellers!
Last Agent to Sell the Property
Wilson Realtors, West Union License #2011001415 Listed on: 04/15/2015
| Date | Buyer | Sale Price | Title Company |
|---|---|---|---|
| Graber Steven | -- | None Listed On Document | |
| Dinsmore Adam | -- | None Available | |
| Dinsmore Adam | $63,000 | None Available |
| Date | Status | Borrower | Loan Amount |
|---|---|---|---|
| Previous Owner | Dinsmore Adam | $47,250 |
| Date | Event | Price | List to Sale | Price per Sq Ft |
|---|---|---|---|---|
| 11/09/2015 11/09/15 | Off Market | $63,000 | -- | -- |
| 08/11/2015 08/11/15 | Sold | $63,000 | -14.9% | $47 / Sq Ft |
| 06/17/2015 06/17/15 | Pending | -- | -- | -- |
| 04/15/2015 04/15/15 | For Sale | $74,000 | -- | $55 / Sq Ft |
| Year | Tax Paid | Tax Assessment Tax Assessment Total Assessment is a certain percentage of the fair market value that is determined by local assessors to be the total taxable value of land and additions on the property. | Land | Improvement |
|---|---|---|---|---|
| 2025 | $1,306 | $34,860 | $2,170 | $32,690 |
| 2024 | $1,306 | $34,860 | $2,170 | $32,690 |
| 2023 | $1,410 | $34,860 | $2,170 | $32,690 |
| 2022 | $1,201 | $28,460 | $1,650 | $26,810 |
| 2021 | $1,060 | $28,460 | $1,650 | $26,810 |
| 2020 | $1,084 | $28,460 | $1,650 | $26,810 |
| 2019 | $1,084 | $28,460 | $1,650 | $26,810 |
| 2018 | $990 | $24,960 | $1,650 | $23,310 |
| 2017 | $975 | $24,960 | $1,650 | $23,310 |
| 2016 | $973 | $24,960 | $1,650 | $23,310 |
| 2015 | $1,000 | $26,430 | $1,650 | $24,780 |
| 2014 | $1,001 | $26,430 | $1,650 | $24,780 |
Seller's Agent in 2015
Jamie Bennington
Wilson Realtors, West Union
(937) 205-2060
8 in this area
28 Total Sales
T
Buyer's Agent in 2015
Tyler Wilson
Wilson Realtors, West Union
(937) 478-5393
46 Total Sales
Source: MLS of Greater Cincinnati (CincyMLS)
MLS Number: 1446247
APN: 117-34-01-008.001
Disclaimer: Certain information contained herein is derived from information provided by parties other than Homes.com. All information provided is deemed reliable, but is not guaranteed to be accurate and should be independently verified.
![]() The data relating to real estate for sale on this website comes in part from the Broker Reciprocity programs of the MLS of Greater Cincinnati, Inc.. Those listings held by brokerage firms other than Ten-X are marked with the Broker Reciprocity logo and house icon. The properties displayed may not be all of the properties available through Broker Reciprocity.
The data relating to real estate for sale on this website comes in part from the Broker Reciprocity programs of the MLS of Greater Cincinnati, Inc.. Those listings held by brokerage firms other than Ten-X are marked with the Broker Reciprocity logo and house icon. The properties displayed may not be all of the properties available through Broker Reciprocity.
IDX information is provided exclusively for personal, non-commercial use, and may not be used for any purpose other than to identify prospective properties consumers may be interested in purchasing.
Information is deemed reliable but not guaranteed.
Ten-X does not display the entire Cincinnati MLS Broker Reciprocity™ database on this web site. The listings of some real estate brokerage firms have been excluded.
Copyright 2026, MLS of Greater Cincinnati, Inc. All rights reserved