421 W 11th St Davenport, IA 52803
Central Davenport NeighborhoodEstimated Value: $87,000 - $116,000
2
Beds
1
Bath
720
Sq Ft
$142/Sq Ft
Est. Value
About This Home
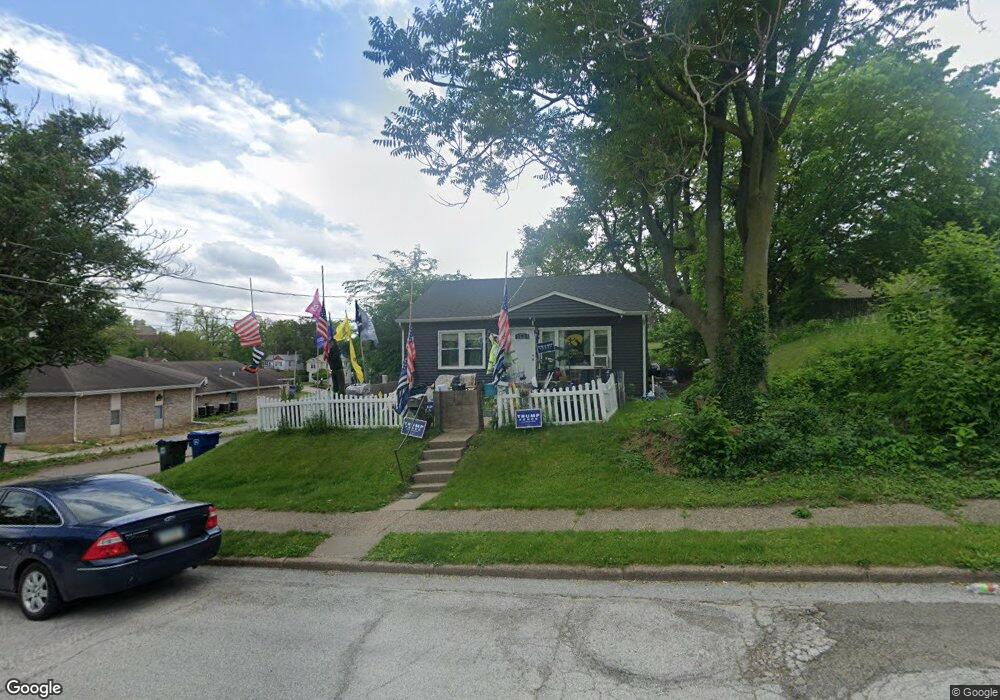
This home is located at 421 W 11th St, Davenport, IA 52803 and is currently estimated at $102,458, approximately $142 per square foot. 421 W 11th St is a home located in Scott County with nearby schools including Walnut Hill Elementary School, Crofton Elementary School, and Casey County Middle School.
Ownership History
Date
Name
Owned For
Owner Type
Purchase Details
Closed on
Dec 8, 2020
Sold by
Selby Blake
Bought by
Selby Enterprises Llc
Current Estimated Value
Purchase Details
Closed on
Nov 23, 2020
Sold by
Selby Enterprises Llc
Bought by
Pink John and Turner Ilaria
Purchase Details
Closed on
Oct 31, 2006
Sold by
Ohp 1 Lc
Bought by
Myers Phillip T and Myers Phillip
Home Financials for this Owner
Home Financials are based on the most recent Mortgage that was taken out on this home.
Original Mortgage
$50,400
Interest Rate
6.45%
Mortgage Type
New Conventional
Create a Home Valuation Report for This Property
The Home Valuation Report is an in-depth analysis detailing your home's value as well as a comparison with similar homes in the area
Home Values in the Area
Average Home Value in this Area
Purchase History
| Date | Buyer | Sale Price | Title Company |
|---|---|---|---|
| Selby Enterprises Llc | -- | None Listed On Document | |
| Pink John | $529,500 | None Listed On Document | |
| Myers Phillip T | $32,500 | None Available |
Source: Public Records
Mortgage History
| Date | Status | Borrower | Loan Amount |
|---|---|---|---|
| Previous Owner | Myers Phillip T | $50,400 |
Source: Public Records
Tax History Compared to Growth
Tax History
| Year | Tax Paid | Tax Assessment Tax Assessment Total Assessment is a certain percentage of the fair market value that is determined by local assessors to be the total taxable value of land and additions on the property. | Land | Improvement |
|---|---|---|---|---|
| 2025 | $1,068 | $84,290 | $14,490 | $69,800 |
| 2024 | $1,042 | $59,780 | $14,490 | $45,290 |
| 2023 | $1,153 | $59,780 | $14,490 | $45,290 |
| 2022 | $921 | $40,250 | $7,130 | $33,120 |
| 2021 | $864 | $40,250 | $7,130 | $33,120 |
| 2020 | $1,255 | $32,250 | $7,130 | $25,120 |
| 2019 | $1,113 | $32,250 | $7,130 | $25,120 |
| 2018 | $996 | $32,250 | $7,130 | $25,120 |
| 2017 | $734 | $32,250 | $7,130 | $25,120 |
| 2016 | $871 | $32,250 | $0 | $0 |
| 2015 | $706 | $29,910 | $0 | $0 |
| 2014 | $664 | $29,910 | $0 | $0 |
| 2013 | $652 | $0 | $0 | $0 |
| 2012 | -- | $27,020 | $7,430 | $19,590 |
Source: Public Records
Map
Nearby Homes