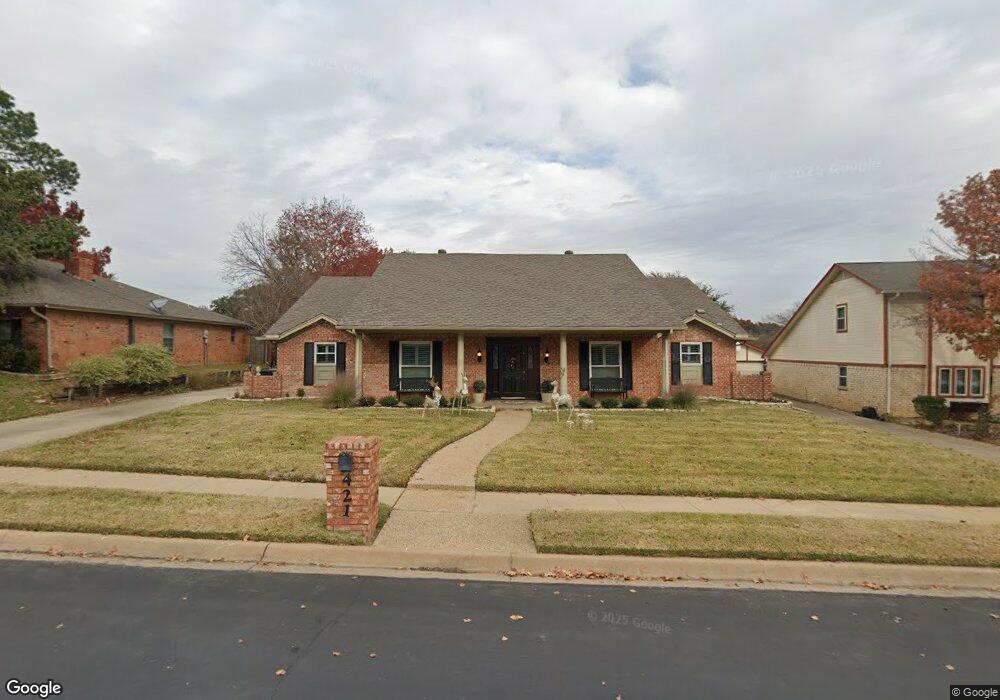
421 Warbler Dr Bedford, TX 76021
Estimated Value: $634,000 - $727,000
6
Beds
4
Baths
3,153
Sq Ft
$218/Sq Ft
Est. Value
About This Home
This home is located at 421 Warbler Dr, Bedford, TX 76021 and is currently estimated at $688,220, approximately $218 per square foot. 421 Warbler Dr is a home located in Tarrant County with nearby schools including Bedford Heights Elementary School, Bedford Junior High School, and L.D. Bell High School.
Ownership History
Date
Name
Owned For
Owner Type
Purchase Details
Closed on
Jul 10, 2015
Sold by
Anderson Cody B and Anderson Cheri L
Bought by
Damon William T
Current Estimated Value
Home Financials for this Owner
Home Financials are based on the most recent Mortgage that was taken out on this home.
Original Mortgage
$381,693
Outstanding Balance
$298,037
Interest Rate
3.9%
Mortgage Type
Purchase Money Mortgage
Estimated Equity
$390,183
Purchase Details
Closed on
Sep 17, 2012
Sold by
Dodds Steven Morris and Dodds Stacy Layne
Bought by
Anderson Cody B and Snderson Cheri L
Home Financials for this Owner
Home Financials are based on the most recent Mortgage that was taken out on this home.
Original Mortgage
$230,000
Interest Rate
3.66%
Mortgage Type
Purchase Money Mortgage
Create a Home Valuation Report for This Property
The Home Valuation Report is an in-depth analysis detailing your home's value as well as a comparison with similar homes in the area
Home Values in the Area
Average Home Value in this Area
Purchase History
| Date | Buyer | Sale Price | Title Company |
|---|---|---|---|
| Damon William T | -- | Fatco | |
| Anderson Cody B | -- | None Available |
Source: Public Records
Mortgage History
| Date | Status | Borrower | Loan Amount |
|---|---|---|---|
| Open | Damon William T | $381,693 | |
| Previous Owner | Anderson Cody B | $230,000 |
Source: Public Records
Tax History Compared to Growth
Tax History
| Year | Tax Paid | Tax Assessment Tax Assessment Total Assessment is a certain percentage of the fair market value that is determined by local assessors to be the total taxable value of land and additions on the property. | Land | Improvement |
|---|---|---|---|---|
| 2025 | $8,269 | $646,580 | $100,000 | $546,580 |
| 2024 | $8,269 | $646,580 | $100,000 | $546,580 |
| 2023 | $8,650 | $646,811 | $75,000 | $571,811 |
| 2022 | $8,955 | $410,000 | $75,000 | $335,000 |
| 2021 | $9,328 | $410,000 | $75,000 | $335,000 |
| 2020 | $8,559 | $360,000 | $75,000 | $285,000 |
| 2019 | $8,746 | $360,000 | $75,000 | $285,000 |
| 2018 | $8,624 | $355,000 | $75,000 | $280,000 |
| 2017 | $8,984 | $371,370 | $45,000 | $326,370 |
| 2016 | $8,661 | $358,003 | $45,000 | $313,003 |
| 2015 | $7,102 | $282,800 | $26,000 | $256,800 |
| 2014 | $7,102 | $282,800 | $26,000 | $256,800 |
Source: Public Records
Map
Nearby Homes
- 405 Woodbriar Ct
- 305 Warbler Dr
- 320 Blue Quail Ct
- 3605 Spring Valley Dr
- 3213 Spring Valley Dr
- 628 Huntwich Dr
- 3609 Wayne Ct
- 3119 Spring Grove Dr
- 913 Kensington Ct
- 909 Brestol Ct W
- 3624 Wayne Ct
- 801 Shady Creek Ln
- 432 Sunnybrook Ct
- 3713 Brentwood Ct
- 922 Shady Creek Ln
- 1109 Simpson Terrace
- 1013 Springdale Rd
- 404 Heather Ln
- 2620 Brookridge Dr
- 817 Shady Lake Dr
- 417 Warbler Dr
- 3320 Bobwhite Dr
- 409 Quail Crest Dr
- 409 Quail Crest Dr
- 413 Warbler Dr
- 413 Quail Crest Dr
- 413 Quail Crest Dr
- 407 Quail Crest Dr
- 3316 Bobwhite Dr
- 428 Wren Ct
- 3313 Bobwhite Dr
- 409 Warbler Dr
- 501 Quail Crest Dr
- 405 Quail Crest Dr
- 3312 Bobwhite Dr
- 424 Wren Ct
- 3309 Bobwhite Dr
- 408 Wren Ct
- 3429 Brown Trail
- 405 Warbler Dr