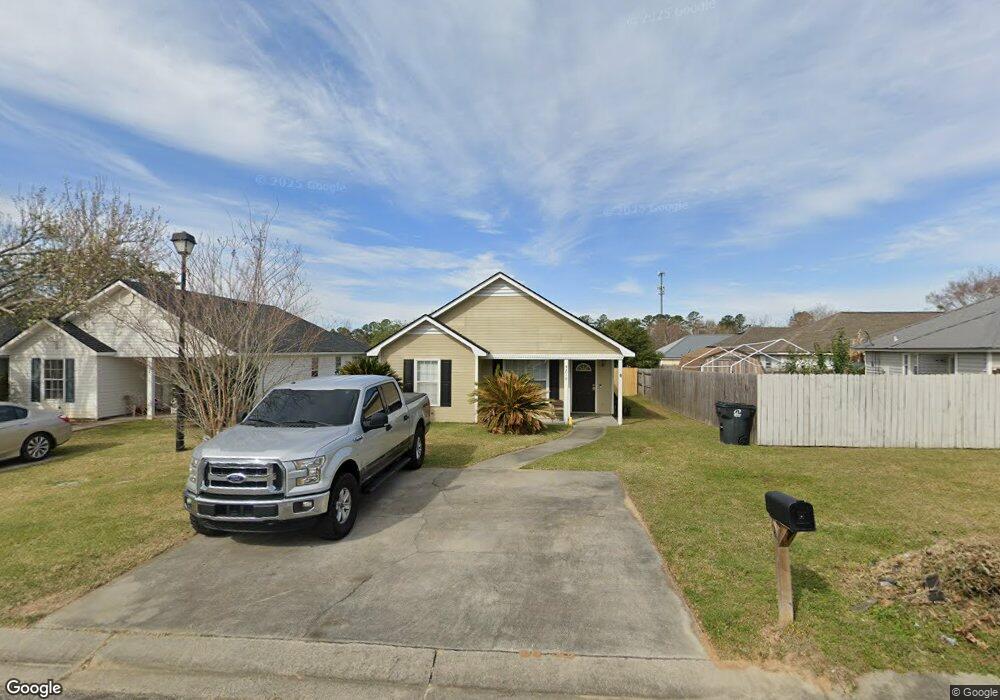
4210 Abingdon Ct Valdosta, GA 31605
Estimated Value: $136,000 - $168,000
3
Beds
2
Baths
1,148
Sq Ft
$134/Sq Ft
Est. Value
About This Home
This home is located at 4210 Abingdon Ct, Valdosta, GA 31605 and is currently estimated at $153,469, approximately $133 per square foot. 4210 Abingdon Ct is a home located in Lowndes County with nearby schools including Dewar Elementary School, Pine Grove Middle School, and Lowndes High School.
Ownership History
Date
Name
Owned For
Owner Type
Purchase Details
Closed on
Feb 3, 2012
Current Estimated Value
Purchase Details
Closed on
May 3, 2011
Sold by
Mcmahon Joshua and Mcmahon Melanie
Bought by
Flagstar Bank Fsb
Purchase Details
Closed on
Oct 29, 2007
Sold by
Deason William D
Bought by
Mcmahon Joshua and Mcmahon Melanie
Home Financials for this Owner
Home Financials are based on the most recent Mortgage that was taken out on this home.
Original Mortgage
$102,047
Interest Rate
6.26%
Mortgage Type
VA
Purchase Details
Closed on
Jun 7, 2000
Sold by
Secretary Of Veterans Af
Bought by
Deason William D
Purchase Details
Closed on
Dec 7, 1999
Sold by
Terrell Frederick A
Bought by
Secretary Of Veterans Af
Purchase Details
Closed on
Nov 20, 1996
Bought by
Terrell Frederick A
Purchase Details
Closed on
Jun 25, 1996
Bought by
Coody Tom D and Coody B
Purchase Details
Closed on
Aug 4, 1995
Bought by
Rhb Piedmont Development
Create a Home Valuation Report for This Property
The Home Valuation Report is an in-depth analysis detailing your home's value as well as a comparison with similar homes in the area
Home Values in the Area
Average Home Value in this Area
Purchase History
| Date | Buyer | Sale Price | Title Company |
|---|---|---|---|
| -- | $53,000 | -- | |
| Wmi Llc | $53,000 | -- | |
| Flagstar Bank Fsb | $78,400 | -- | |
| Secretary Of Veterans Affairs | $78,436 | -- | |
| Flagstar Bank Fsb | $78,436 | -- | |
| Mcmahon Joshua | $99,900 | -- | |
| Deason William D | $57,000 | -- | |
| Secretary Of Veterans Af | $50,000 | -- | |
| Terrell Frederick A | $61,900 | -- | |
| Coody Tom D | $11,500 | -- | |
| Rhb Piedmont Development | $10,500 | -- |
Source: Public Records
Mortgage History
| Date | Status | Borrower | Loan Amount |
|---|---|---|---|
| Previous Owner | Mcmahon Joshua | $102,047 |
Source: Public Records
Tax History Compared to Growth
Tax History
| Year | Tax Paid | Tax Assessment Tax Assessment Total Assessment is a certain percentage of the fair market value that is determined by local assessors to be the total taxable value of land and additions on the property. | Land | Improvement |
|---|---|---|---|---|
| 2024 | $1,207 | $48,018 | $5,000 | $43,018 |
| 2023 | $1,207 | $44,528 | $5,000 | $39,528 |
| 2022 | $962 | $32,293 | $5,000 | $27,293 |
| 2021 | $825 | $26,233 | $5,000 | $21,233 |
| 2020 | $771 | $26,233 | $5,000 | $21,233 |
| 2019 | $778 | $26,233 | $5,000 | $21,233 |
| 2018 | $0 | $26,233 | $5,000 | $21,233 |
| 2017 | $676 | $22,193 | $5,000 | $17,193 |
| 2016 | $678 | $22,193 | $5,000 | $17,193 |
| 2015 | -- | $22,193 | $5,000 | $17,193 |
| 2014 | $913 | $31,233 | $10,000 | $21,233 |
Source: Public Records
Map
Nearby Homes
- 4175 Hamilton Cir
- 4300 Bemiss Rd
- 3802 Pondside Cir
- 3378 Dinky Run
- 3515 Spence Dr
- 3747 Robin Ln
- The Palm A Plan at Bemiss Springs
- The Palm B Plan at Bemiss Springs
- 4234 Whithorn Way
- 4119 Aslan Rd
- 6420 Abney Ct
- 6412 Abney Ct
- 3789 Heatherwoods Dr
- 4084 Mulligan Rd
- 4072 Maranatha Ln
- 4060 Maranatha Ln
- 4049 Applecross Rd
- 4139 Whithorn Way
- 3830 Coventry Dr
- 3735 Studstill Rd
- 4212 Abingdon Ct
- 4150 Hamilton Cir
- 4152 Hamilton Cir
- 4214 Abingdon Ct
- 4214 Abingdon Ct
- 0 Abingdon Ct
- 4148 Hamilton Cir
- 4132 Hamilton Cir
- 4130 Hamilton Cir
- 4216 Abingdon Ct
- 4128 Hamilton Cir
- 4140 Hamilton Cir
- 4158 Hamilton Cir
- 4209 Abingdon Ct
- 4126 Hamilton Cir
- 4211 Abingdon Ct
- 4218 Abingdon Ct
- 4160 Hamilton Cir
- 4124 Hamilton Cir
- 4151 Hamilton Cir