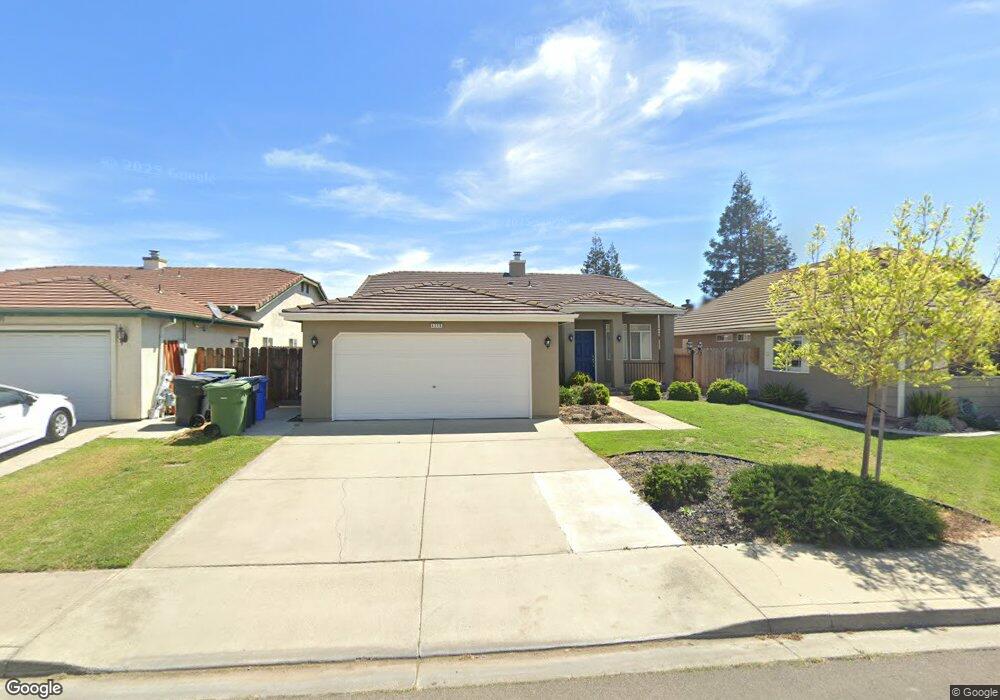
4210 Donovan Way Turlock, CA 95382
Estimated Value: $486,161 - $524,000
3
Beds
2
Baths
1,688
Sq Ft
$299/Sq Ft
Est. Value
About This Home
This home is located at 4210 Donovan Way, Turlock, CA 95382 and is currently estimated at $505,540, approximately $299 per square foot. 4210 Donovan Way is a home located in Stanislaus County with nearby schools including Sandra Tovar Medeiros Elementary School, Turlock Junior High School, and Marvin A. Dutcher Middle School.
Ownership History
Date
Name
Owned For
Owner Type
Purchase Details
Closed on
Oct 26, 2015
Sold by
Baysinger Barbara K
Bought by
Baysinger Barbara and Barbara Baysinger 2015 Trust
Current Estimated Value
Purchase Details
Closed on
Jun 26, 2009
Sold by
Perry Trevor W
Bought by
Baysinger Lisa C and Baysinger Barbara K
Home Financials for this Owner
Home Financials are based on the most recent Mortgage that was taken out on this home.
Original Mortgage
$218,469
Outstanding Balance
$139,068
Interest Rate
4.83%
Mortgage Type
FHA
Estimated Equity
$366,472
Purchase Details
Closed on
Aug 5, 1997
Sold by
Anthony Donovan Inc
Bought by
Perry Trevor W and Perry Susan E
Home Financials for this Owner
Home Financials are based on the most recent Mortgage that was taken out on this home.
Original Mortgage
$138,951
Interest Rate
7.43%
Mortgage Type
FHA
Create a Home Valuation Report for This Property
The Home Valuation Report is an in-depth analysis detailing your home's value as well as a comparison with similar homes in the area
Home Values in the Area
Average Home Value in this Area
Purchase History
| Date | Buyer | Sale Price | Title Company |
|---|---|---|---|
| Baysinger Barbara | -- | None Available | |
| Baysinger Lisa C | $222,500 | Stewart Title Of California | |
| Perry Trevor W | $141,500 | North American Title Co |
Source: Public Records
Mortgage History
| Date | Status | Borrower | Loan Amount |
|---|---|---|---|
| Open | Baysinger Lisa C | $218,469 | |
| Previous Owner | Perry Trevor W | $138,951 |
Source: Public Records
Tax History Compared to Growth
Tax History
| Year | Tax Paid | Tax Assessment Tax Assessment Total Assessment is a certain percentage of the fair market value that is determined by local assessors to be the total taxable value of land and additions on the property. | Land | Improvement |
|---|---|---|---|---|
| 2024 | $3,147 | $280,896 | $82,056 | $198,840 |
| 2023 | $3,143 | $275,390 | $80,448 | $194,942 |
| 2022 | $3,105 | $269,991 | $78,871 | $191,120 |
| 2021 | $3,061 | $264,698 | $77,325 | $187,373 |
| 2020 | $3,041 | $261,985 | $76,533 | $185,452 |
| 2019 | $2,992 | $256,849 | $75,033 | $181,816 |
| 2018 | $2,990 | $251,813 | $73,562 | $178,251 |
| 2017 | $2,923 | $246,876 | $72,120 | $174,756 |
| 2016 | $2,738 | $242,036 | $70,706 | $171,330 |
| 2015 | $2,716 | $238,401 | $69,644 | $168,757 |
| 2014 | $2,614 | $233,732 | $68,280 | $165,452 |
Source: Public Records
Map
Nearby Homes
- 4184 Horizon Ct
- 1062 Ashford Dr
- 1173 Woodland Dr
- 4162 Piccadilly Ln
- 624 Summerton Ln
- 4591 Sandpiper Cir
- 494 Summerton Ln
- 1360 Shady Ln Unit 522
- 1360 Shady Ln Unit 923
- 715 W Taylor Rd
- 4188 Fall Creek Ct
- 3884 Paula Ct
- 3723 Honeycreeper Dr
- 1815 Addison Dr
- 4305 Pastoral Ave
- 217 Castile Ln
- 4004 St George Place
- 4320 Panorama Ave
- 3076 Radford Way
- 342 Sunnyhill Dr
- 4220 Donovan Way
- 4200 Donovan Way
- 4230 Donovan Way
- 4180 Donovan Way
- 4215 Mckenna Dr
- 4225 Mckenna Dr
- 4205 Mckenna Dr
- 4235 Mckenna Dr
- 4185 Mckenna Dr
- 4240 Donovan Way
- 4160 Donovan Way
- 4205 Donovan Way
- 4215 Donovan Way
- 4185 Donovan Way
- 4225 Donovan Way
- 4245 Mckenna Dr
- 4165 Mckenna Dr
- 4175 Donovan Way
- 4250 Donovan Way
- 4235 Donovan Way