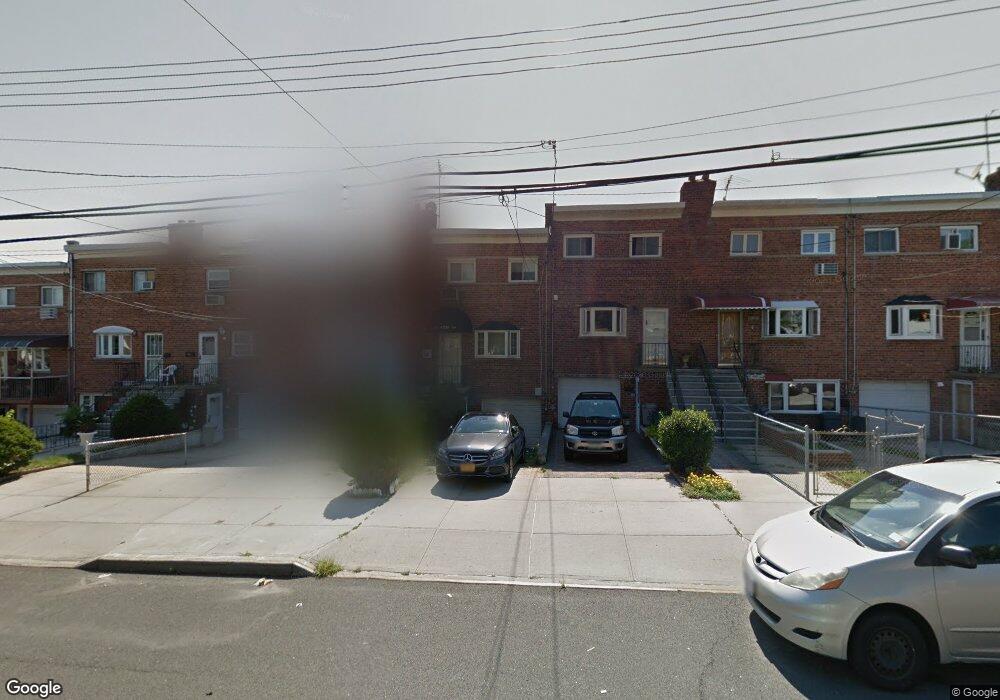
4210 E Tremont Ave Bronx, NY 10465
Throgs Neck-Edgewater Park NeighborhoodEstimated Value: $591,021 - $700,000
Studio
--
Bath
1,589
Sq Ft
$418/Sq Ft
Est. Value
About This Home
This home is located at 4210 E Tremont Ave, Bronx, NY 10465 and is currently estimated at $663,505, approximately $417 per square foot. 4210 E Tremont Ave is a home located in Bronx County with nearby schools including P.S. 72 - Dr. William Dorney, Herbert H Lehman High School, and St. Frances de Chantal School.
Ownership History
Date
Name
Owned For
Owner Type
Purchase Details
Closed on
Sep 7, 2016
Sold by
Johnson Alfonso and Johnson Sheniqua
Bought by
Johnson Sheniqua
Current Estimated Value
Home Financials for this Owner
Home Financials are based on the most recent Mortgage that was taken out on this home.
Original Mortgage
$316,000
Outstanding Balance
$252,409
Interest Rate
3.43%
Mortgage Type
Purchase Money Mortgage
Estimated Equity
$411,096
Purchase Details
Closed on
Feb 7, 2005
Sold by
Rodriguez Faith and Rodriguez Nelly
Bought by
Williams John
Home Financials for this Owner
Home Financials are based on the most recent Mortgage that was taken out on this home.
Original Mortgage
$277,500
Interest Rate
5.78%
Mortgage Type
Purchase Money Mortgage
Purchase Details
Closed on
Apr 1, 1997
Sold by
Sottile Michael
Bought by
Rodriguez Faith and Rodriguez Nelly
Home Financials for this Owner
Home Financials are based on the most recent Mortgage that was taken out on this home.
Original Mortgage
$127,812
Interest Rate
7.86%
Mortgage Type
FHA
Create a Home Valuation Report for This Property
The Home Valuation Report is an in-depth analysis detailing your home's value as well as a comparison with similar homes in the area
Home Values in the Area
Average Home Value in this Area
Purchase History
| Date | Buyer | Sale Price | Title Company |
|---|---|---|---|
| Johnson Sheniqua | -- | -- | |
| Williams John | $370,000 | -- | |
| Rodriguez Faith | $179,000 | Commonwealth Land Title Ins |
Source: Public Records
Mortgage History
| Date | Status | Borrower | Loan Amount |
|---|---|---|---|
| Open | Johnson Sheniqua | $316,000 | |
| Previous Owner | Williams John | $277,500 | |
| Previous Owner | Rodriguez Faith | $127,812 |
Source: Public Records
Tax History
| Year | Tax Paid | Tax Assessment Tax Assessment Total Assessment is a certain percentage of the fair market value that is determined by local assessors to be the total taxable value of land and additions on the property. | Land | Improvement |
|---|---|---|---|---|
| 2025 | $5,865 | $29,203 | $6,937 | $22,266 |
| 2024 | $5,865 | $29,203 | $6,801 | $22,402 |
| 2023 | $5,886 | $28,982 | $6,739 | $22,243 |
| 2022 | $5,458 | $33,900 | $8,580 | $25,320 |
| 2021 | $5,126 | $34,500 | $8,580 | $25,920 |
| 2020 | $4,855 | $31,920 | $8,580 | $23,340 |
| 2019 | $5,091 | $28,380 | $8,580 | $19,800 |
| 2018 | $4,626 | $24,152 | $7,524 | $16,628 |
| 2017 | $4,345 | $22,785 | $8,045 | $14,740 |
| 2016 | $3,987 | $21,496 | $8,026 | $13,470 |
| 2015 | $2,656 | $20,280 | $9,540 | $10,740 |
| 2014 | $2,656 | $20,280 | $9,540 | $10,740 |
Source: Public Records
Map
Nearby Homes
- 4190 E Tremont Ave
- 4216 E Tremont Ave
- 244 Revere Ave
- 4246 E Tremont Ave
- 249 Calhoun Ave
- 227 Calhoun Ave
- 2976 Lawton Ave
- 2832 Harding Ave
- 238 Swinton Ave
- 156 Revere Ave
- 2819 Collis Place
- 2973 Harding Ave
- 149 Revere Ave
- 2816 Collis Place
- 238A Throggs Neck Blvd
- 252 Brinsmade Ave
- 276 Brinsmade Ave
- 239 Brinsmade Ave
- 416 Revere Ave
- 192 Huntington Ave
- 4208 E Tremont Ave
- 4212 E Tremont Ave
- 4206 E Tremont Ave
- 4214 E Tremont Ave
- 4204 E Tremont Ave
- 4202 E Tremont Ave
- 4218 E Tremont Ave
- 4220 E Tremont Ave
- 4200 E Tremont Ave
- 4222 E Tremont Ave
- 246 Revere Ave
- 250 Revere Ave
- 248 Revere Ave
- 252 Revere Ave
- 4224 E Tremont Ave
- 242 Revere Ave
- 254 Revere Ave
- 240 Revere Ave
- 256 Revere Ave
- 238 Revere Ave
Your Personal Tour Guide
Ask me questions while you tour the home.