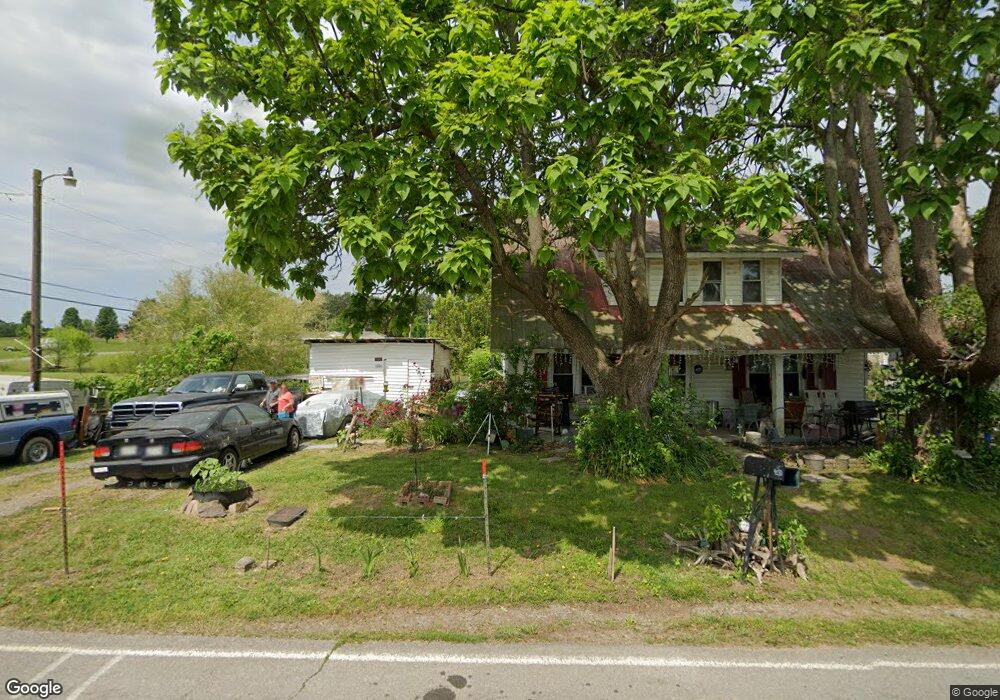
4210 N Mohawk Rd Mohawk, TN 37810
Estimated Value: $172,801 - $188,000
3
Beds
2
Baths
1,402
Sq Ft
$127/Sq Ft
Est. Value
About This Home
This home is located at 4210 N Mohawk Rd, Mohawk, TN 37810 and is currently estimated at $177,950, approximately $126 per square foot. 4210 N Mohawk Rd is a home located in Greene County with nearby schools including McDonald Elementary School, West Greene Middle Schools, and West Greene High School.
Ownership History
Date
Name
Owned For
Owner Type
Purchase Details
Closed on
Mar 23, 2007
Sold by
Ferguson Marvin
Bought by
Porter Melody J
Current Estimated Value
Home Financials for this Owner
Home Financials are based on the most recent Mortgage that was taken out on this home.
Original Mortgage
$63,050
Outstanding Balance
$37,616
Interest Rate
6.18%
Estimated Equity
$140,334
Create a Home Valuation Report for This Property
The Home Valuation Report is an in-depth analysis detailing your home's value as well as a comparison with similar homes in the area
Purchase History
| Date | Buyer | Sale Price | Title Company |
|---|---|---|---|
| Porter Melody J | $65,000 | -- |
Source: Public Records
Mortgage History
| Date | Status | Borrower | Loan Amount |
|---|---|---|---|
| Open | Porter Melody J | $63,050 |
Source: Public Records
Tax History
| Year | Tax Paid | Tax Assessment Tax Assessment Total Assessment is a certain percentage of the fair market value that is determined by local assessors to be the total taxable value of land and additions on the property. | Land | Improvement |
|---|---|---|---|---|
| 2025 | -- | $35,000 | $3,850 | $31,150 |
| 2024 | $578 | $35,000 | $3,850 | $31,150 |
| 2023 | $578 | $35,000 | $0 | $0 |
| 2022 | $36,300 | $18,000 | $2,725 | $15,275 |
| 2021 | $363 | $18,000 | $2,725 | $15,275 |
| 2020 | $363 | $18,000 | $2,725 | $15,275 |
| 2019 | $363 | $18,000 | $2,725 | $15,275 |
| 2018 | $363 | $18,000 | $2,725 | $15,275 |
| 2017 | $279 | $14,150 | $2,725 | $11,425 |
| 2016 | $265 | $14,150 | $2,725 | $11,425 |
| 2015 | $265 | $14,150 | $2,725 | $11,425 |
| 2014 | $265 | $14,150 | $2,725 | $11,425 |
Source: Public Records
Map
Nearby Homes
- 4250 N Mohawk Rd
- Tbd Copperhead Hollow Rd Unit LotWP001
- 1550 Mount Hope #2 Rd
- 1550 Mount Hope #1 Rd
- 1550 Mount Hope Rd Unit 2
- 1550 Mount Hope Rd Unit 1
- 1550 Mount Hope Rd
- 860 Yellow Springs Rd
- 1040 Yellow Springs Rd
- 480 Obe Kirk Loop
- 3.35 Oakwood Rd
- N/A Oakwood Rd
- 4045 S Mohawk Rd
- 780 Murray Bridge Rd
- 585 Murray Bridge Rd
- Tbd Democrat Rd
- 100 Democrat Rd
- 0 Dyer Hollow Rd Unit 9992070
- 1530 Easterly Rd
- 750 Tom White Hollow Rd
- 4240 N Mohawk Rd
- 4190 N Mohawk Rd
- 4190 N Mohawk Rd Unit Auction
- 45 Catawba Rd
- 4150 N Mohawk Rd
- 4280 N Mohawk Rd
- 4085 N Mohawk Rd
- 140 Catawba Rd
- 4345 N Mohawk Rd
- 00 Catawba Rd
- 4400 N Mohawk Rd
- 3955 N Mohawk Rd
- 4405 N Mohawk Rd
- 260 Catawba Rd
- 4000 N Mohawk Rd
- 620 Mount Hope Rd
- 300 Mount Hope Rd
- 445 Mount Hope Rd
- 4555 N Mohawk Rd
- 3775 N Mohawk Rd
Your Personal Tour Guide
Ask me questions while you tour the home.