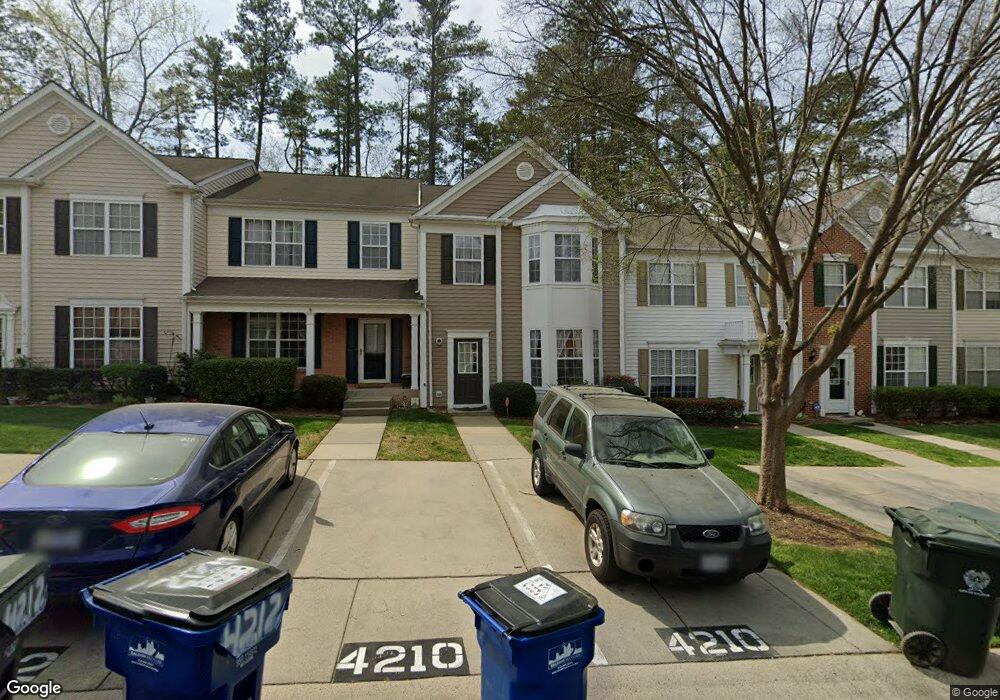
4210 Vienna Crest Dr Raleigh, NC 27613
Northwest Raleigh NeighborhoodEstimated Value: $310,917 - $357,000
3
Beds
3
Baths
1,400
Sq Ft
$236/Sq Ft
Est. Value
About This Home
This home is located at 4210 Vienna Crest Dr, Raleigh, NC 27613 and is currently estimated at $330,729, approximately $236 per square foot. 4210 Vienna Crest Dr is a home located in Wake County with nearby schools including Hilburn Academy, Leesville Road High School, and The Montessori School of Raleigh.
Ownership History
Date
Name
Owned For
Owner Type
Purchase Details
Closed on
Aug 7, 2017
Sold by
Pettiford Helen Munt and Pettiford Joseph Michael
Bought by
Moshe Ido Ben and Moshe Keren Ben
Current Estimated Value
Home Financials for this Owner
Home Financials are based on the most recent Mortgage that was taken out on this home.
Original Mortgage
$124,250
Outstanding Balance
$66,268
Interest Rate
3.88%
Mortgage Type
New Conventional
Estimated Equity
$264,461
Purchase Details
Closed on
May 29, 2007
Sold by
Bilder Sarah
Bought by
Munt Helen Rutledge
Home Financials for this Owner
Home Financials are based on the most recent Mortgage that was taken out on this home.
Original Mortgage
$140,505
Interest Rate
6.12%
Mortgage Type
Unknown
Purchase Details
Closed on
Oct 18, 2001
Sold by
Pulte Home Corp
Bought by
Bilder Sarah
Home Financials for this Owner
Home Financials are based on the most recent Mortgage that was taken out on this home.
Original Mortgage
$102,348
Interest Rate
6.87%
Create a Home Valuation Report for This Property
The Home Valuation Report is an in-depth analysis detailing your home's value as well as a comparison with similar homes in the area
Home Values in the Area
Average Home Value in this Area
Purchase History
| Date | Buyer | Sale Price | Title Company |
|---|---|---|---|
| Moshe Ido Ben | $177,500 | None Available | |
| Munt Helen Rutledge | $148,000 | None Available | |
| Bilder Sarah | $128,000 | -- |
Source: Public Records
Mortgage History
| Date | Status | Borrower | Loan Amount |
|---|---|---|---|
| Open | Moshe Ido Ben | $124,250 | |
| Previous Owner | Munt Helen Rutledge | $140,505 | |
| Previous Owner | Bilder Sarah | $102,348 | |
| Closed | Bilder Sarah | $12,793 |
Source: Public Records
Tax History Compared to Growth
Tax History
| Year | Tax Paid | Tax Assessment Tax Assessment Total Assessment is a certain percentage of the fair market value that is determined by local assessors to be the total taxable value of land and additions on the property. | Land | Improvement |
|---|---|---|---|---|
| 2025 | $2,757 | $313,788 | $100,000 | $213,788 |
| 2024 | $2,745 | $313,788 | $100,000 | $213,788 |
| 2023 | $2,251 | $204,669 | $45,000 | $159,669 |
| 2022 | $2,092 | $204,669 | $45,000 | $159,669 |
| 2021 | $2,011 | $204,669 | $45,000 | $159,669 |
| 2020 | $1,975 | $204,669 | $45,000 | $159,669 |
| 2019 | $1,674 | $142,726 | $30,000 | $112,726 |
| 2018 | $1,579 | $142,726 | $30,000 | $112,726 |
| 2017 | $1,505 | $142,726 | $30,000 | $112,726 |
| 2016 | $1,474 | $142,726 | $30,000 | $112,726 |
| 2015 | $1,539 | $146,695 | $33,000 | $113,695 |
| 2014 | $1,460 | $146,695 | $33,000 | $113,695 |
Source: Public Records
Map
Nearby Homes
- 6063 Epping Forest Dr
- 7613 Percy Ct
- 6051 Epping Forest Dr
- 502 Plumleaf Rd
- 6036 Epping Forest Dr
- 8713 Little Deer Ln
- 4536 Hamptonshire Dr
- 4424 Tetbury Place
- 3811 Lunceston Way Unit 208
- 7108 Sandringham Dr
- 6736 Hammersmith Dr
- 4541 Hershey Ct
- 4416 Lancashire Dr
- 4211 Norman Ridge Ln
- 4103 Landfall Ct
- 4104 Betterton Dr
- 6648 Mafolie Ct
- 5548 Red Robin Rd
- 6408 Shadow Ct
- 5529 Golden Arrow Ln
- 4212 Vienna Crest Dr
- 4208 Vienna Crest Dr
- 4206 Vienna Crest Dr
- 4214 Vienna Crest Dr
- 4204 Vienna Crest Dr
- 4224 Vienna Crest Dr
- 4202 Vienna Crest Dr
- 4226 Vienna Crest Dr
- 4200 Vienna Crest Dr
- 4228 Vienna Crest Dr
- 4213 Vienna Crest Dr
- 4215 Vienna Crest Dr
- 4211 Vienna Crest Dr
- 4217 Vienna Crest Dr
- 4230 Vienna Crest Dr
- 4221 Vienna Crest Dr
- 4223 Vienna Crest Dr
- 4232 Vienna Crest Dr
- 4225 Vienna Crest Dr
- 4234 Vienna Crest Dr