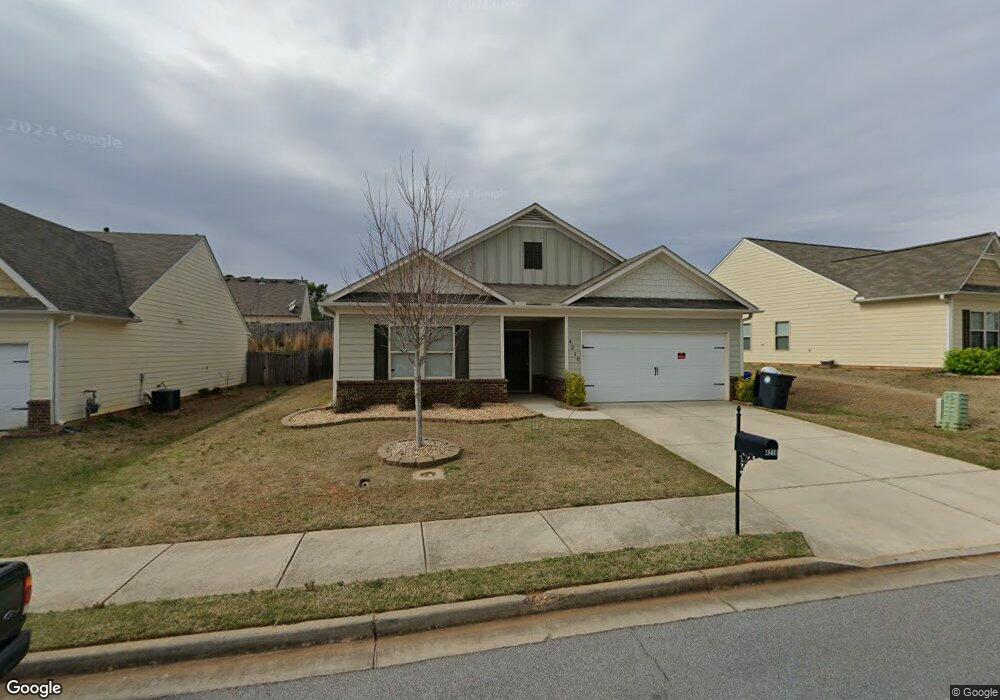
4210 Windscape Way Unit LOT 157 Gainesville, GA 30504
Mundy Mill NeighborhoodEstimated Value: $349,000 - $384,000
3
Beds
2
Baths
1,910
Sq Ft
$193/Sq Ft
Est. Value
About This Home
This home is located at 4210 Windscape Way Unit LOT 157, Gainesville, GA 30504 and is currently estimated at $367,880, approximately $192 per square foot. 4210 Windscape Way Unit LOT 157 is a home located in Hall County with nearby schools including Mundy Mill Academy, Gainesville High School, and Elachee Nature Academy.
Ownership History
Date
Name
Owned For
Owner Type
Purchase Details
Closed on
May 20, 2021
Sold by
Pham Thuy Thi
Bought by
Fkh Sfr Propco D Lp
Current Estimated Value
Purchase Details
Closed on
Apr 27, 2018
Sold by
Stephens Matthew
Bought by
Pham Thuy Thi and Do Lang H
Home Financials for this Owner
Home Financials are based on the most recent Mortgage that was taken out on this home.
Original Mortgage
$168,000
Interest Rate
4.44%
Mortgage Type
New Conventional
Purchase Details
Closed on
Apr 30, 2015
Sold by
Lgi Homes Maple Park Llc
Bought by
Winn Kelly and Stephens Matthew
Home Financials for this Owner
Home Financials are based on the most recent Mortgage that was taken out on this home.
Original Mortgage
$169,767
Interest Rate
3.8%
Mortgage Type
FHA
Purchase Details
Closed on
Jun 26, 2013
Sold by
Res-Ga Travers Creek Llc
Bought by
Lgi Homes-Maple Park Llc
Create a Home Valuation Report for This Property
The Home Valuation Report is an in-depth analysis detailing your home's value as well as a comparison with similar homes in the area
Home Values in the Area
Average Home Value in this Area
Purchase History
| Date | Buyer | Sale Price | Title Company |
|---|---|---|---|
| Fkh Sfr Propco D Lp | $315,000 | -- | |
| Pham Thuy Thi | $210,000 | -- | |
| Winn Kelly | $172,900 | -- | |
| Lgi Homes-Maple Park Llc | $2,408,400 | -- |
Source: Public Records
Mortgage History
| Date | Status | Borrower | Loan Amount |
|---|---|---|---|
| Previous Owner | Pham Thuy Thi | $168,000 | |
| Previous Owner | Winn Kelly | $169,767 |
Source: Public Records
Tax History Compared to Growth
Tax History
| Year | Tax Paid | Tax Assessment Tax Assessment Total Assessment is a certain percentage of the fair market value that is determined by local assessors to be the total taxable value of land and additions on the property. | Land | Improvement |
|---|---|---|---|---|
| 2024 | $4,027 | $140,600 | $21,600 | $119,000 |
| 2023 | $598 | $149,000 | $20,680 | $128,320 |
| 2022 | $569 | $120,680 | $21,200 | $99,480 |
| 2021 | $463 | $90,880 | $11,600 | $79,280 |
| 2020 | $2,520 | $84,200 | $9,200 | $75,000 |
| 2019 | $2,424 | $79,840 | $9,000 | $70,840 |
| 2018 | $452 | $76,240 | $10,000 | $66,240 |
| 2017 | $448 | $66,800 | $10,000 | $56,800 |
| 2016 | $2,095 | $69,560 | $10,000 | $59,560 |
| 2015 | -- | $4,400 | $4,400 | $0 |
Source: Public Records
Map
Nearby Homes
- 5295 Way Unit 181
- 5287 Magnolia Place Unit 179
- 4219 Box Elder Path
- 4248 Box Elder Path
- 4319 Box Elder Path
- 4245 Pearhaven Ln SW
- 4636 Silver Oak Dr SW
- 4554 Silver Oak Dr SW
- 4405 Chestnut Oak Way SW
- 4671 Cypress Park Dr
- Jasmine Plan at The Grove At Mundy Mill
- Jade I Plan at The Grove At Mundy Mill
- Jade II Plan at The Grove At Mundy Mill
- 4380 Rockrose Green Way
- 4840 Orchard Grove Way Unit 174
- 5287 Magnolia Grove Way Unit 179
- 5287 Magnolia Grove Way
- 5299 Magnolia Grove Way
- 5299 Magnolia Grove Way Unit 182
- 5295 Magnolia Grove Way Unit 181
- 4210 Windscape Way
- 4210 Windscape Way
- 4214 Windscape Way
- 4206 Windscape Way
- 4213 Weeping Willow Dr Unit 162
- 4213 Weeping Willow Dr
- 4217 Weeping Willow Dr Unit 163
- 4217 Weeping Willow Dr
- 4209 Weeping Willow Dr Unit 161
- 4209 Weeping Willow Dr
- 4218 Windscape Way
- 4202 Windscape Way
- 4214 Magnolia Place
- 4221 Weeping Willow Dr Unit 164
- 4221 Weeping Willow Dr
- 421 Windscape Way
- 4205 Weeping Willow Dr Unit LOT 160
- 4205 Weeping Willow Dr
- 0 Windscape Way
- 4215 Magnolia Place Unit 129