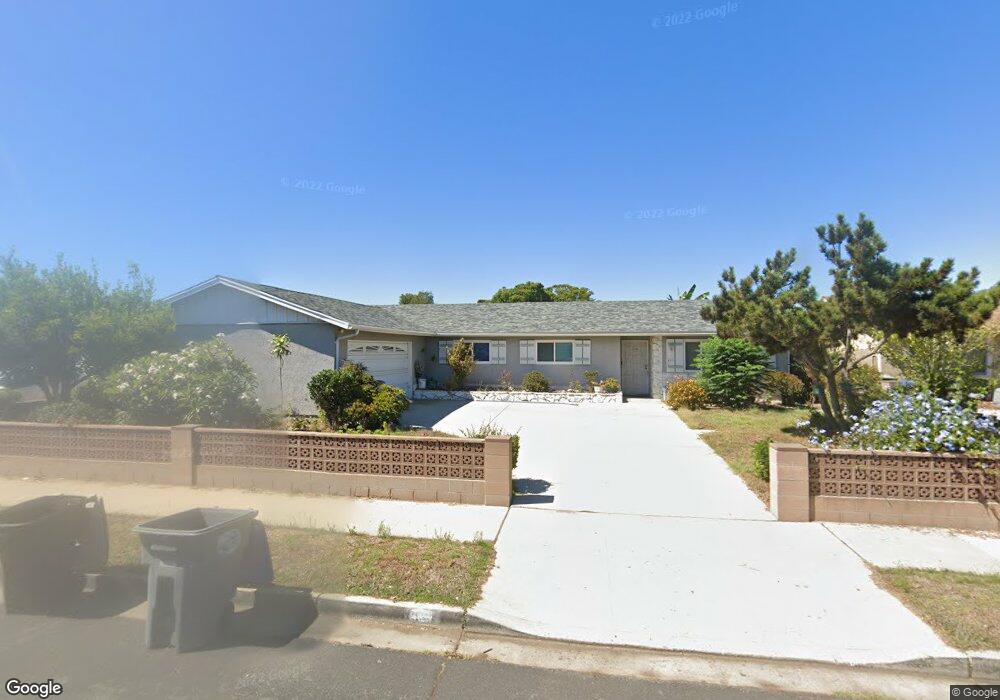
4211 Anchorage St Oxnard, CA 93033
College Estates NeighborhoodEstimated Value: $726,068 - $778,000
5
Beds
2
Baths
1,568
Sq Ft
$480/Sq Ft
Est. Value
About This Home
This home is located at 4211 Anchorage St, Oxnard, CA 93033 and is currently estimated at $753,267, approximately $480 per square foot. 4211 Anchorage St is a home located in Ventura County with nearby schools including Fred L. Williams Elementary School and Channel Islands High School.
Ownership History
Date
Name
Owned For
Owner Type
Purchase Details
Closed on
Nov 17, 1995
Sold by
Reyes Samuel P and Reyes Lourdes B
Bought by
Reyes Samuel Pungtilan and Reyes Lourdes Binag
Current Estimated Value
Create a Home Valuation Report for This Property
The Home Valuation Report is an in-depth analysis detailing your home's value as well as a comparison with similar homes in the area
Home Values in the Area
Average Home Value in this Area
Purchase History
| Date | Buyer | Sale Price | Title Company |
|---|---|---|---|
| Reyes Samuel Pungtilan | -- | -- |
Source: Public Records
Tax History
| Year | Tax Paid | Tax Assessment Tax Assessment Total Assessment is a certain percentage of the fair market value that is determined by local assessors to be the total taxable value of land and additions on the property. | Land | Improvement |
|---|---|---|---|---|
| 2025 | $53 | $77,284 | $15,797 | $61,487 |
| 2024 | $53 | $75,769 | $15,487 | $60,282 |
| 2023 | $52 | $74,284 | $15,184 | $59,100 |
| 2022 | $52 | $72,828 | $14,886 | $57,942 |
| 2021 | $52 | $71,400 | $14,594 | $56,806 |
| 2020 | $52 | $70,671 | $14,446 | $56,225 |
| 2019 | $52 | $69,286 | $14,163 | $55,123 |
| 2018 | $52 | $67,929 | $13,886 | $54,043 |
| 2017 | $51 | $66,598 | $13,614 | $52,984 |
| 2016 | $51 | $65,294 | $13,348 | $51,946 |
| 2015 | $51 | $64,316 | $13,149 | $51,167 |
| 2014 | $51 | $63,059 | $12,893 | $50,166 |
Source: Public Records
Map
Nearby Homes
- 4340 Highland Ave
- 860 Morro Way
- 4221 Justin Way
- 5117 Jefferson Square
- 4160 Petit Dr Unit 39
- 5222 Longfellow Way
- 280 Columbia Place Unit 48
- 360 Ibsen Place Unit 129
- 2117 Cardinal Ave Unit 2117h
- 3130 Paula St
- 3151 Fournier St
- 2167 Robin Ave
- 3700 Olds Rd Unit 38
- 3700 Olds Rd Unit 86
- 2177 Robin Ave Unit 2177A
- 3631 La Costa Place
- 140 Gaviota Place Unit 157
- 2178 Thrush Ave Unit J
- 1645 Lime Ave Unit 91
- 4200 S A St
- 4221 Anchorage St
- 4201 Anchorage St
- 4200 Highland Ave
- 4220 Highland Ave
- 1231 Yale St
- 4231 Anchorage St
- 4230 Highland Ave
- 1221 Yale St
- 4241 Anchorage St
- 4240 Highland Ave
- 4221 Highland Ave
- 1330 Nelson Place
- 1320 Nelson Place
- 1310 Nelson Place
- 1201 Yale St
- 4231 Highland Ave
- 4300 Highland Ave
- 4301 Anchorage St
- 1400 Nelson Place
- 1300 Nelson Place
Your Personal Tour Guide
Ask me questions while you tour the home.