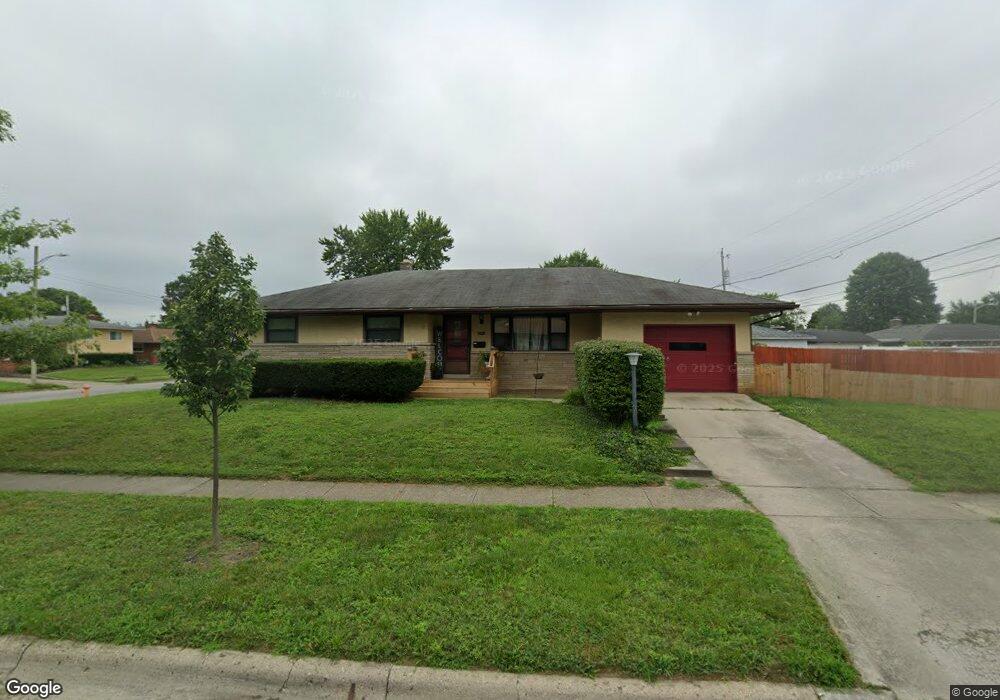
4211 Astor Ave Columbus, OH 43227
Beechwood NeighborhoodEstimated Value: $217,952 - $298,000
3
Beds
2
Baths
1,368
Sq Ft
$182/Sq Ft
Est. Value
About This Home
This home is located at 4211 Astor Ave, Columbus, OH 43227 and is currently estimated at $248,488, approximately $181 per square foot. 4211 Astor Ave is a home located in Franklin County with nearby schools including Shady Lane Elementary School, Sherwood Middle School, and Walnut Ridge High School.
Ownership History
Date
Name
Owned For
Owner Type
Purchase Details
Closed on
Jun 30, 2006
Sold by
Wise Claude Jeffrey and Wise Julie
Bought by
Smith Sylvester and Smith Floree
Current Estimated Value
Home Financials for this Owner
Home Financials are based on the most recent Mortgage that was taken out on this home.
Original Mortgage
$118,874
Interest Rate
9.11%
Mortgage Type
Seller Take Back
Purchase Details
Closed on
Mar 18, 2005
Sold by
Wise Claude Jeffrey and Wise Julie
Bought by
Smith Sylvester and Smith Floree
Home Financials for this Owner
Home Financials are based on the most recent Mortgage that was taken out on this home.
Original Mortgage
$120,000
Interest Rate
7.83%
Mortgage Type
Seller Take Back
Purchase Details
Closed on
Jul 11, 2001
Sold by
Dean Ruth E
Bought by
Wise Claude Jeffrey and Wise Julie L
Home Financials for this Owner
Home Financials are based on the most recent Mortgage that was taken out on this home.
Original Mortgage
$105,069
Interest Rate
7.22%
Mortgage Type
FHA
Purchase Details
Closed on
Nov 22, 1971
Bought by
Dean Ruth E
Create a Home Valuation Report for This Property
The Home Valuation Report is an in-depth analysis detailing your home's value as well as a comparison with similar homes in the area
Home Values in the Area
Average Home Value in this Area
Purchase History
| Date | Buyer | Sale Price | Title Company |
|---|---|---|---|
| Smith Sylvester | $118,874 | None Available | |
| Smith Sylvester | $123,000 | -- | |
| Wise Claude Jeffrey | $105,900 | Foundation Title Agency Inc | |
| Dean Ruth E | -- | -- |
Source: Public Records
Mortgage History
| Date | Status | Borrower | Loan Amount |
|---|---|---|---|
| Closed | Smith Sylvester | $118,874 | |
| Closed | Smith Sylvester | $120,000 | |
| Closed | Wise Claude Jeffrey | $105,069 |
Source: Public Records
Tax History Compared to Growth
Tax History
| Year | Tax Paid | Tax Assessment Tax Assessment Total Assessment is a certain percentage of the fair market value that is determined by local assessors to be the total taxable value of land and additions on the property. | Land | Improvement |
|---|---|---|---|---|
| 2024 | $3,007 | $67,000 | $15,020 | $51,980 |
| 2023 | $2,969 | $66,990 | $15,015 | $51,975 |
| 2022 | $2,041 | $39,350 | $6,830 | $32,520 |
| 2021 | $2,045 | $39,350 | $6,830 | $32,520 |
| 2020 | $2,047 | $39,350 | $6,830 | $32,520 |
| 2019 | $1,896 | $31,260 | $5,460 | $25,800 |
| 2018 | $1,823 | $31,260 | $5,460 | $25,800 |
| 2017 | $1,895 | $31,260 | $5,460 | $25,800 |
| 2016 | $1,932 | $29,160 | $5,640 | $23,520 |
| 2015 | $1,754 | $29,160 | $5,640 | $23,520 |
| 2014 | $1,758 | $29,160 | $5,640 | $23,520 |
| 2013 | $1,034 | $34,300 | $6,615 | $27,685 |
Source: Public Records
Map
Nearby Homes
- 1291 Westphal Ave
- 4181 Colby Ave
- 4363 E Mound St
- 4295 Colby Ave
- 1220 Elderwood Ave
- 963 Erickson Ave
- 1281 Maetzel Dr
- 1490 Elaine Rd Unit 1462
- 3945 Dillon Dr
- 3955 E Fulton St
- 1068 Ross Rd
- 1294 Dellwood Ave
- 4144 Mcallister Ave
- 4467 Grimsby Rd
- 4484 Grimsby Rd
- 4501 Amesbury Rd
- 1085 S Hamilton Rd
- 4530 Amesbury Rd
- 1543 S Hamilton Rd
- 4094 E Main St
- 1235 Pierce Ave
- 4195 Astor Ave
- 1243 Pierce Ave
- 4212 Astor Ave
- 1228 Erickson Rd
- 4235 Astor Ave
- 1251 Pierce Ave
- 1238 Pierce Ave
- 1201 Pierce Ave
- 1246 Pierce Ave
- 4236 Astor Ave
- 1244 Erickson Rd
- 1196 Erickson Rd
- 1259 Pierce Ave
- 1196 Erickson Ave
- 1193 Pierce Ave
- 1254 Pierce Ave
- 1204 Pierce Ave
- 1252 Erickson Rd
- 1188 Erickson Rd