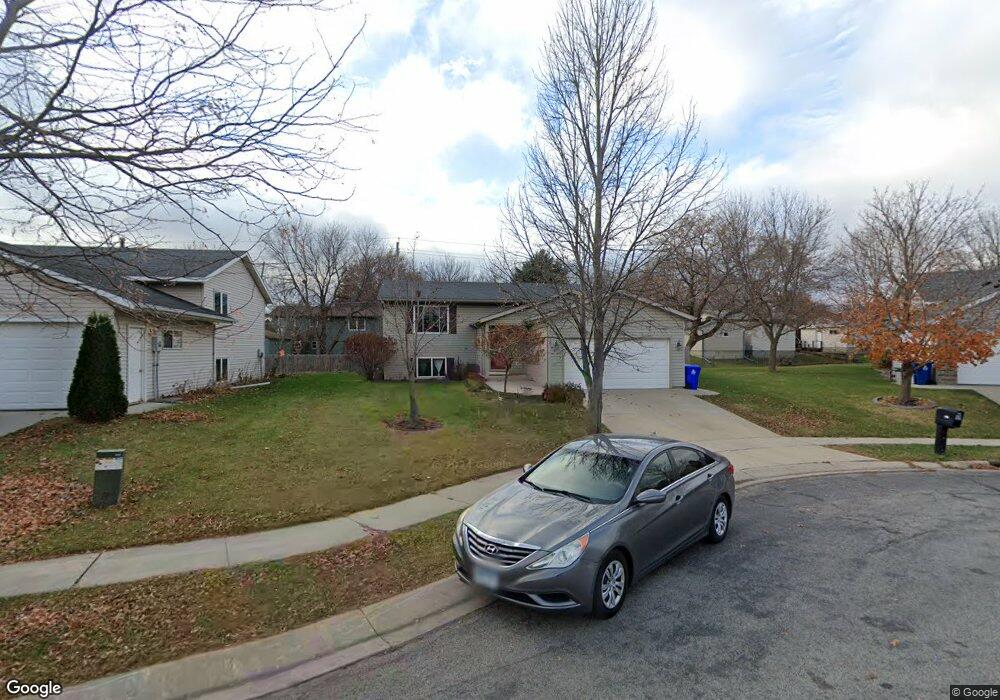
4211 Glouster Ln NW Rochester, MN 55901
Estimated Value: $322,000 - $364,093
4
Beds
2
Baths
1,894
Sq Ft
$180/Sq Ft
Est. Value
About This Home
This home is located at 4211 Glouster Ln NW, Rochester, MN 55901 and is currently estimated at $341,523, approximately $180 per square foot. 4211 Glouster Ln NW is a home located in Olmsted County with nearby schools including Gage Elementary School, John Adams Middle School, and John Marshall Senior High School.
Ownership History
Date
Name
Owned For
Owner Type
Purchase Details
Closed on
Jul 8, 2022
Sold by
Moore Ashley
Bought by
Fezea Luma
Current Estimated Value
Home Financials for this Owner
Home Financials are based on the most recent Mortgage that was taken out on this home.
Original Mortgage
$173,000
Outstanding Balance
$164,604
Interest Rate
5.1%
Mortgage Type
New Conventional
Estimated Equity
$176,919
Purchase Details
Closed on
Apr 6, 2018
Sold by
Rath Sambath
Bought by
Moore Ashley M
Home Financials for this Owner
Home Financials are based on the most recent Mortgage that was taken out on this home.
Original Mortgage
$204,670
Interest Rate
4.43%
Mortgage Type
New Conventional
Purchase Details
Closed on
Sep 16, 2011
Sold by
Mollen Joseph S and Shefelbine Tammy L
Bought by
Rath Sambath
Home Financials for this Owner
Home Financials are based on the most recent Mortgage that was taken out on this home.
Original Mortgage
$118,750
Interest Rate
3.9%
Mortgage Type
New Conventional
Create a Home Valuation Report for This Property
The Home Valuation Report is an in-depth analysis detailing your home's value as well as a comparison with similar homes in the area
Home Values in the Area
Average Home Value in this Area
Purchase History
| Date | Buyer | Sale Price | Title Company |
|---|---|---|---|
| Fezea Luma | $350,000 | -- | |
| Moore Ashley M | $211,000 | Rochester Title | |
| Rath Sambath | $125,000 | Multiple |
Source: Public Records
Mortgage History
| Date | Status | Borrower | Loan Amount |
|---|---|---|---|
| Open | Fezea Luma | $173,000 | |
| Previous Owner | Moore Ashley M | $204,670 | |
| Previous Owner | Rath Sambath | $118,750 |
Source: Public Records
Tax History Compared to Growth
Tax History
| Year | Tax Paid | Tax Assessment Tax Assessment Total Assessment is a certain percentage of the fair market value that is determined by local assessors to be the total taxable value of land and additions on the property. | Land | Improvement |
|---|---|---|---|---|
| 2024 | $3,734 | $276,000 | $40,000 | $236,000 |
| 2023 | $3,270 | $265,400 | $40,000 | $225,400 |
| 2022 | $2,826 | $255,200 | $40,000 | $215,200 |
| 2021 | $2,602 | $220,400 | $40,000 | $180,400 |
| 2020 | $2,450 | $204,900 | $26,000 | $178,900 |
| 2019 | $2,328 | $188,000 | $26,000 | $162,000 |
| 2018 | $2,104 | $180,700 | $26,000 | $154,700 |
| 2017 | $2,064 | $167,700 | $26,000 | $141,700 |
| 2016 | $1,714 | $137,800 | $22,300 | $115,500 |
| 2015 | $808 | $111,300 | $21,200 | $90,100 |
| 2014 | $1,610 | $112,600 | $21,300 | $91,300 |
| 2012 | -- | $115,033 | $21,409 | $93,624 |
Source: Public Records
Map
Nearby Homes
- 1407 41st St NW
- 4017 11th Ave NW
- 3916 17th Ave NW
- 920 Plymouth Ln NW
- 892 Brighton Dr NW
- 4017 18th Ave NW
- XXX County Road 22
- 4037 18th Ave NW
- 3925 18th Ave NW
- 4100 19 1 2 Ln NW
- Sinclair Plan at Essex Estates
- Vanderbilt Plan at Essex Estates
- Lewis Plan at Essex Estates
- Mckinley Plan at Essex Estates
- 870 Portsmith Dr NW
- 928 Milborne Ln NW
- 4618 Buckingham Dr NW
- 914 Milborne Ln NW
- 885 Picadilly Ln NW
- 874 Londonderry Dr NW
- 4205 Glouster Ln NW
- 4217 Glouster Ln NW
- 4210 13th Ave NW
- 4139 Glouster Ln NW
- 4204 13th Ave NW
- 4216 13th Ave NW
- 4140 13th Ave NW
- 4224 Glouster Ln NW
- 4220 4220 13th-Avenue-nw
- 4220 13th Ave NW
- 4133 Glouster Ln NW
- 4222 13th Ave NW
- 4206 Glouster Ln NW
- 4212 Glouster Ln NW
- 4134 13th Ave NW
- 4300 13th Ave NW
- 4218 Glouster Ln NW
- 4138 Glouster Ln NW
- 4127 Glouster Ln NW
- 4132 Glouster Ln NW