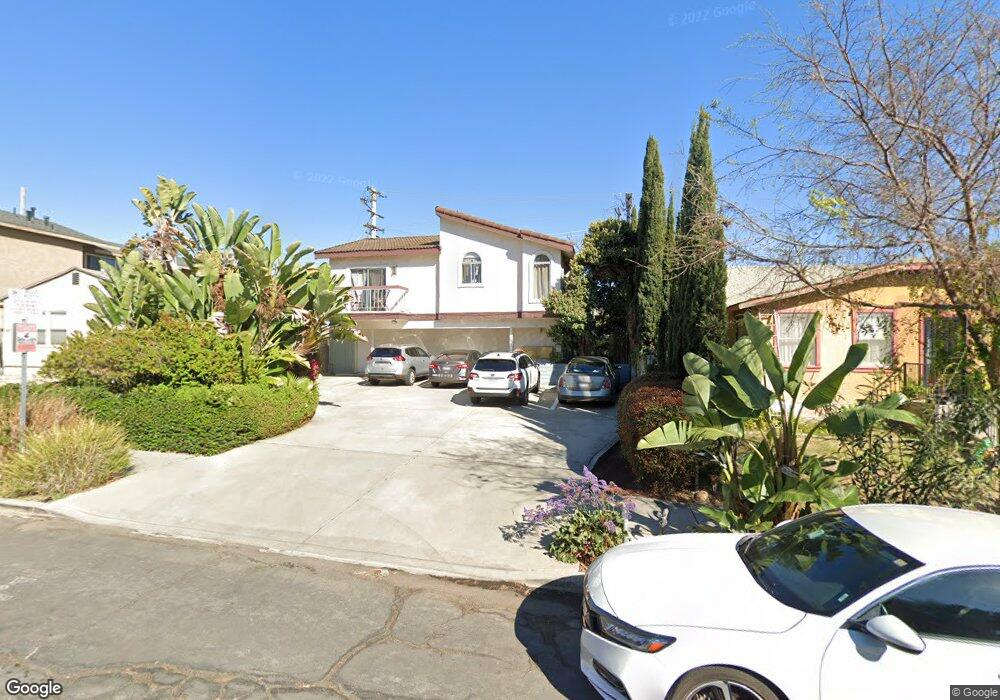
4211 Iowa St Unit 8 San Diego, CA 92104
North Park NeighborhoodEstimated Value: $551,812 - $665,000
2
Beds
2
Baths
898
Sq Ft
$687/Sq Ft
Est. Value
About This Home
This home is located at 4211 Iowa St Unit 8, San Diego, CA 92104 and is currently estimated at $617,203, approximately $687 per square foot. 4211 Iowa St Unit 8 is a home located in San Diego County with nearby schools including Garfield Elementary, Roosevelt International Middle School, and North Park Christian School.
Ownership History
Date
Name
Owned For
Owner Type
Purchase Details
Closed on
Mar 6, 2020
Sold by
Diep Chandara
Bought by
Diep Chandara
Current Estimated Value
Purchase Details
Closed on
May 27, 2014
Sold by
Schachter Benjamin A and Schachter Paula M
Bought by
Diep Chandara
Home Financials for this Owner
Home Financials are based on the most recent Mortgage that was taken out on this home.
Original Mortgage
$289,750
Outstanding Balance
$220,804
Interest Rate
4.25%
Mortgage Type
New Conventional
Estimated Equity
$396,399
Purchase Details
Closed on
Apr 11, 2012
Sold by
Holden Dale L and Holden Jean E
Bought by
Schachter Benjamin A and Schachter Paula M
Purchase Details
Closed on
Aug 18, 1994
Sold by
Holden Jean E and Lane Jean E
Bought by
Holden Dale L and Holden Jean E
Home Financials for this Owner
Home Financials are based on the most recent Mortgage that was taken out on this home.
Original Mortgage
$40,000
Interest Rate
5.12%
Purchase Details
Closed on
Oct 14, 1988
Purchase Details
Closed on
Feb 29, 1984
Create a Home Valuation Report for This Property
The Home Valuation Report is an in-depth analysis detailing your home's value as well as a comparison with similar homes in the area
Home Values in the Area
Average Home Value in this Area
Purchase History
| Date | Buyer | Sale Price | Title Company |
|---|---|---|---|
| Diep Chandara | -- | None Available | |
| Diep Chandara | $305,000 | Corinthian Title | |
| Schachter Benjamin A | $146,500 | Western Resources Title | |
| Holden Dale L | -- | Benefit Land Title Company | |
| -- | $73,000 | -- | |
| -- | $60,200 | -- |
Source: Public Records
Mortgage History
| Date | Status | Borrower | Loan Amount |
|---|---|---|---|
| Open | Diep Chandara | $289,750 | |
| Previous Owner | Holden Dale L | $40,000 |
Source: Public Records
Tax History Compared to Growth
Tax History
| Year | Tax Paid | Tax Assessment Tax Assessment Total Assessment is a certain percentage of the fair market value that is determined by local assessors to be the total taxable value of land and additions on the property. | Land | Improvement |
|---|---|---|---|---|
| 2025 | $4,556 | $373,877 | $159,546 | $214,331 |
| 2024 | $4,556 | $366,547 | $156,418 | $210,129 |
| 2023 | $4,369 | $359,360 | $153,351 | $206,009 |
| 2022 | $4,250 | $352,315 | $150,345 | $201,970 |
| 2021 | $4,219 | $345,408 | $147,398 | $198,010 |
| 2020 | $4,167 | $341,867 | $145,887 | $195,980 |
| 2019 | $4,091 | $335,165 | $143,027 | $192,138 |
| 2018 | $3,841 | $328,594 | $140,223 | $188,371 |
| 2017 | $83 | $322,152 | $137,474 | $184,678 |
| 2016 | $3,754 | $315,836 | $134,779 | $181,057 |
| 2015 | $3,698 | $311,093 | $132,755 | $178,338 |
| 2014 | $1,731 | $150,059 | $64,036 | $86,023 |
Source: Public Records
Map
Nearby Homes
- 3245 Bramson Place
- 4170 33rd St Unit 204
- 4051-53 32nd St
- 4205 Ohio St Unit 204
- 4205 Ohio St Unit 106
- 3320 Orange Ave
- 4115 Wabash Ave
- 4030 Ohio St
- 4366 Ohio St
- 4347 30th St Unit 53
- 4074 30th St
- 3939 Illinois St Unit 1C
- 4119-23 Kansas
- 4449-55 Illinois St
- 4486 32nd St
- 3950 Ohio St Unit 507
- 4481 Bancroft St
- 3957 30th St Unit 319
- 4448 Felton St
- 4153-55 Utah St
- 4211 Iowa St
- 4211 Iowa St Unit 7
- 4211 Iowa St Unit 6
- 4211 Iowa St Unit 5
- 4211 Iowa St Unit 4
- 4211 Iowa St Unit 3
- 4211 Iowa St Unit 2
- 4211 Iowa St Unit 1
- 4219 Iowa St Unit 21
- 4207 Iowa St
- 3166 Howard Ave
- 4227 Iowa St
- 4204 Boundary St Unit H
- 4204 Boundary St
- 4212 Boundary St Unit 16
- 4220-26 Boundary St
- 4220 Boundary St Unit 26
- 3163 Howard Ave Unit 67
- 4212 Iowa St
- 4204 Iowa St