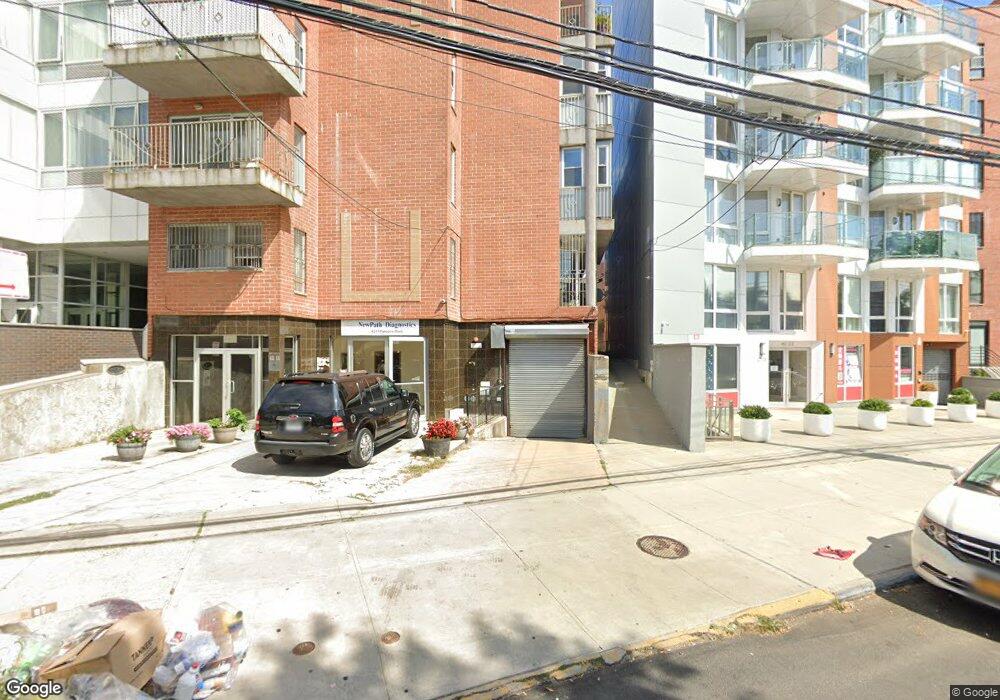
4211 Parsons Blvd Unit 3B Flushing, NY 11355
Flushing NeighborhoodEstimated Value: $652,501 - $727,000
2
Beds
2
Baths
750
Sq Ft
$930/Sq Ft
Est. Value
About This Home
This home is located at 4211 Parsons Blvd Unit 3B, Flushing, NY 11355 and is currently estimated at $697,875, approximately $930 per square foot. 4211 Parsons Blvd Unit 3B is a home located in Queens County with nearby schools including P.S. 22 - Thomas Jefferson, J.H.S. 189Q Daniel Carter Beard, and Flushing High School.
Ownership History
Date
Name
Owned For
Owner Type
Purchase Details
Closed on
Apr 28, 2010
Sold by
Shih George C
Bought by
Chen Linda Xiao
Current Estimated Value
Purchase Details
Closed on
Sep 12, 2007
Sold by
Parsons Point Properties L P
Bought by
Shih George C
Create a Home Valuation Report for This Property
The Home Valuation Report is an in-depth analysis detailing your home's value as well as a comparison with similar homes in the area
Home Values in the Area
Average Home Value in this Area
Purchase History
| Date | Buyer | Sale Price | Title Company |
|---|---|---|---|
| Chen Linda Xiao | $367,068 | -- | |
| Shih George C | -- | -- |
Source: Public Records
Tax History Compared to Growth
Tax History
| Year | Tax Paid | Tax Assessment Tax Assessment Total Assessment is a certain percentage of the fair market value that is determined by local assessors to be the total taxable value of land and additions on the property. | Land | Improvement |
|---|---|---|---|---|
| 2025 | $6,881 | $55,738 | $3,659 | $52,079 |
| 2024 | $6,881 | $55,038 | $3,659 | $51,379 |
| 2023 | $6,919 | $55,341 | $3,659 | $51,682 |
| 2022 | $5,410 | $53,666 | $3,659 | $50,007 |
| 2021 | $3,963 | $49,955 | $3,659 | $46,296 |
| 2020 | $3,193 | $56,433 | $3,659 | $52,774 |
| 2019 | $1,919 | $58,975 | $3,659 | $55,316 |
| 2018 | $742 | $49,591 | $3,659 | $45,932 |
| 2017 | $742 | $46,667 | $3,660 | $43,007 |
| 2016 | $752 | $46,667 | $3,660 | $43,007 |
| 2015 | -- | $41,499 | $3,660 | $37,839 |
| 2014 | -- | $39,449 | $3,659 | $35,790 |
Source: Public Records
Map
Nearby Homes
- 42-11 Parsons Blvd Unit Parking
- 42-11 Parsons Blvd Unit 4D
- 42-11 Parsons Blvd Unit 4B
- 42-11 Parsons Blvd Unit 2D
- 4223 Parsons Blvd Unit 1E
- 4223 Parsons Blvd Unit 5D
- 42-05 Parsons Blvd Unit 4A
- 14430 Sanford Ave Unit 4T
- 144-30 Sanford Ave Unit 2C
- 144-30 Sanford Ave Unit 4N
- 144-30 Sanford Ave Unit 5
- 144-44 Sanford Ave Unit 3
- 144-64 Sanford Ave Unit 11
- 144-54 Sanford Ave Unit 38
- 144-27 Sanford Ave Unit 8
- 144-27 Sanford Ave Unit 4
- 144-27 Sanford Ave Unit 2
- 144-27 Sanford Ave Unit 6
- 144-11 Sanford Ave Unit 4K
- 14340 Franklin Ave
- 4211 Parsons Blvd Unit 2C
- 4211 Parsons Blvd Unit 1D
- 4211 Parsons Blvd
- 4211 Parsons Blvd Unit 5A
- 4211 Parsons Blvd Unit 4E
- 4211 Parsons Blvd Unit 4D
- 4211 Parsons Blvd Unit 4C
- 4211 Parsons Blvd Unit 4B
- 4211 Parsons Blvd Unit 4A
- 4211 Parsons Blvd Unit 3E
- 4211 Parsons Blvd Unit 3D
- 4211 Parsons Blvd Unit 3C
- 4211 Parsons Blvd Unit 3B
- 4211 Parsons Blvd Unit 3A
- 4211 Parsons Blvd Unit 2E
- 4211 Parsons Blvd Unit 2D
- 4211 Parsons Blvd Unit 2C
- 4211 Parsons Blvd Unit 2B
- 4211 Parsons Blvd Unit 2A
- 4211 Parsons Blvd Unit 1D