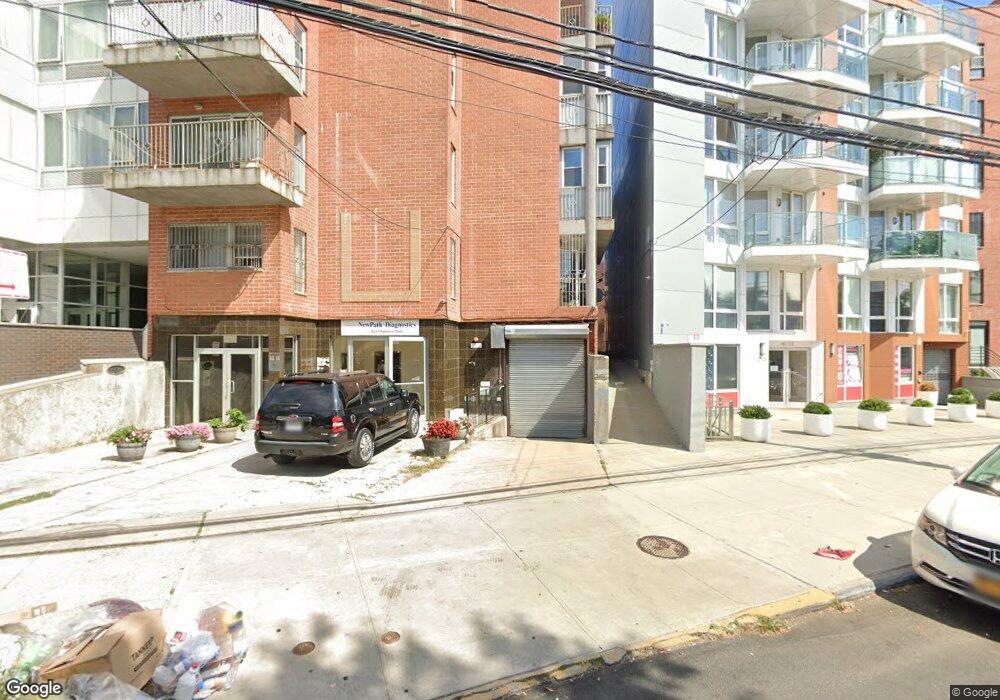
4211 Parsons Blvd Unit 4B Flushing, NY 11355
Flushing NeighborhoodEstimated Value: $649,000 - $708,000
--
Bed
--
Bath
840
Sq Ft
$815/Sq Ft
Est. Value
About This Home
This home is located at 4211 Parsons Blvd Unit 4B, Flushing, NY 11355 and is currently estimated at $685,016, approximately $815 per square foot. 4211 Parsons Blvd Unit 4B is a home located in Queens County with nearby schools including P.S. 22 - Thomas Jefferson, J.H.S. 189Q Daniel Carter Beard, and Flushing High School.
Ownership History
Date
Name
Owned For
Owner Type
Purchase Details
Closed on
Feb 3, 2018
Sold by
Luo Chiyan
Bought by
Luo Chiyan and Zhang Summer
Current Estimated Value
Purchase Details
Closed on
Jan 10, 2017
Sold by
Luo Chiyan and Zhang Summer
Bought by
Luo Chiyan
Purchase Details
Closed on
Jun 24, 2013
Sold by
Yuen Amy K and Yuen Lawren K
Bought by
Luo Chiyan and Zhang Summer
Home Financials for this Owner
Home Financials are based on the most recent Mortgage that was taken out on this home.
Original Mortgage
$225,000
Interest Rate
3.83%
Mortgage Type
New Conventional
Purchase Details
Closed on
May 9, 2007
Sold by
Parsons Point Properties L P
Bought by
Yuen Amy K and Yuen Lawren K
Home Financials for this Owner
Home Financials are based on the most recent Mortgage that was taken out on this home.
Original Mortgage
$255,000
Interest Rate
6.27%
Create a Home Valuation Report for This Property
The Home Valuation Report is an in-depth analysis detailing your home's value as well as a comparison with similar homes in the area
Home Values in the Area
Average Home Value in this Area
Purchase History
| Date | Buyer | Sale Price | Title Company |
|---|---|---|---|
| Luo Chiyan | -- | -- | |
| Luo Chiyan | $200,000 | -- | |
| Luo Chiyan | $450,000 | -- | |
| Luo Chiyan | $450,000 | -- | |
| Yuen Amy K | $455,000 | -- | |
| Yuen Amy K | $455,000 | -- |
Source: Public Records
Mortgage History
| Date | Status | Borrower | Loan Amount |
|---|---|---|---|
| Previous Owner | Luo Chiyan | $225,000 | |
| Previous Owner | Yuen Amy K | $255,000 |
Source: Public Records
Tax History Compared to Growth
Tax History
| Year | Tax Paid | Tax Assessment Tax Assessment Total Assessment is a certain percentage of the fair market value that is determined by local assessors to be the total taxable value of land and additions on the property. | Land | Improvement |
|---|---|---|---|---|
| 2025 | $6,881 | $55,738 | $3,659 | $52,079 |
| 2024 | $6,881 | $55,038 | $3,659 | $51,379 |
| 2023 | $6,919 | $55,341 | $3,659 | $51,682 |
| 2022 | $5,410 | $53,666 | $3,659 | $50,007 |
| 2021 | $3,963 | $49,955 | $3,659 | $46,296 |
| 2020 | $3,193 | $56,433 | $3,659 | $52,774 |
| 2019 | $1,919 | $58,975 | $3,659 | $55,316 |
| 2018 | $742 | $49,591 | $3,659 | $45,932 |
| 2017 | $742 | $46,667 | $3,660 | $43,007 |
| 2016 | $752 | $46,667 | $3,660 | $43,007 |
| 2015 | $588 | $41,499 | $3,660 | $37,839 |
| 2014 | $588 | $39,449 | $3,659 | $35,790 |
Source: Public Records
Map
Nearby Homes
- 42-11 Parsons Blvd Unit Parking
- 42-11 Parsons Blvd Unit 4D
- 42-11 Parsons Blvd Unit 4B
- 42-11 Parsons Blvd Unit 2D
- 4223 Parsons Blvd Unit 1E
- 4223 Parsons Blvd Unit 5D
- 42-05 Parsons Blvd Unit 4A
- 14430 Sanford Ave Unit 4T
- 144-30 Sanford Ave Unit 2C
- 144-30 Sanford Ave Unit 4N
- 144-30 Sanford Ave Unit 5
- 144-44 Sanford Ave Unit 3
- 144-64 Sanford Ave Unit 11
- 144-54 Sanford Ave Unit 38
- 144-27 Sanford Ave Unit 8
- 144-27 Sanford Ave Unit 4
- 144-27 Sanford Ave Unit 2
- 144-27 Sanford Ave Unit 6
- 144-11 Sanford Ave Unit 4K
- 14340 Franklin Ave
- 4211 Parsons Blvd Unit 3B
- 4211 Parsons Blvd Unit 2C
- 4211 Parsons Blvd Unit 1D
- 4211 Parsons Blvd
- 4211 Parsons Blvd Unit 5A
- 4211 Parsons Blvd Unit 4E
- 4211 Parsons Blvd Unit 4D
- 4211 Parsons Blvd Unit 4C
- 4211 Parsons Blvd Unit 4A
- 4211 Parsons Blvd Unit 3E
- 4211 Parsons Blvd Unit 3D
- 4211 Parsons Blvd Unit 3C
- 4211 Parsons Blvd Unit 3B
- 4211 Parsons Blvd Unit 3A
- 4211 Parsons Blvd Unit 2E
- 4211 Parsons Blvd Unit 2D
- 4211 Parsons Blvd Unit 2C
- 4211 Parsons Blvd Unit 2B
- 4211 Parsons Blvd Unit 2A
- 4211 Parsons Blvd Unit 1D