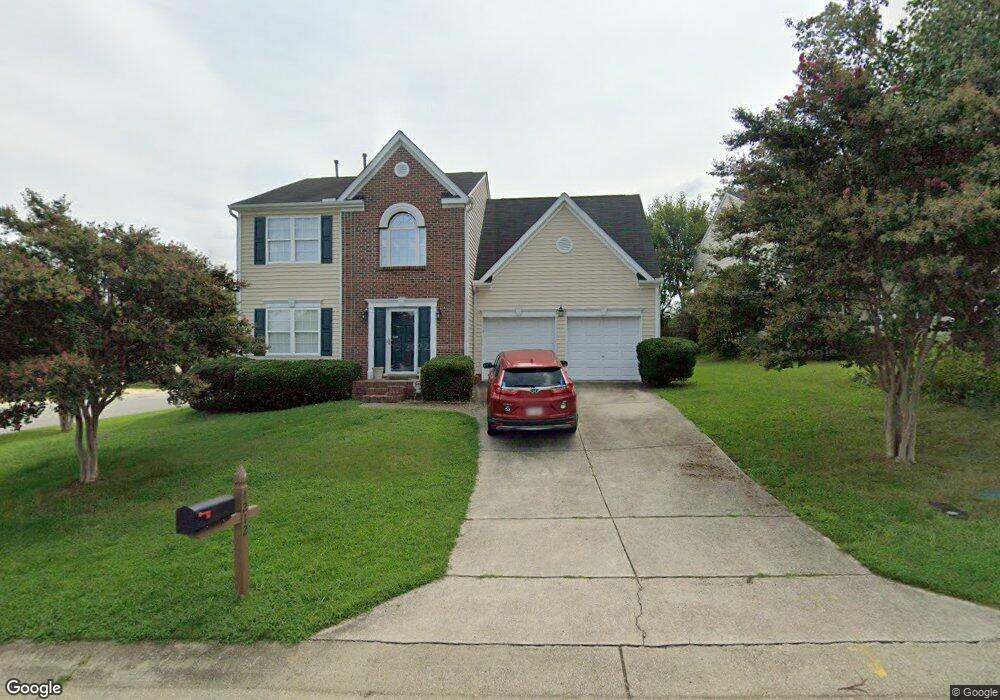
4212 Claybourne Dr Raleigh, NC 27616
Northeast Raleigh NeighborhoodEstimated Value: $374,000 - $380,000
3
Beds
3
Baths
1,950
Sq Ft
$193/Sq Ft
Est. Value
About This Home
This home is located at 4212 Claybourne Dr, Raleigh, NC 27616 and is currently estimated at $376,528, approximately $193 per square foot. 4212 Claybourne Dr is a home located in Wake County with nearby schools including River Bend Elementary, River Bend Middle, and Rolesville High School.
Ownership History
Date
Name
Owned For
Owner Type
Purchase Details
Closed on
Jun 13, 2021
Sold by
Coogan Thomas Gerard
Bought by
Hickey Abe Edward
Current Estimated Value
Purchase Details
Closed on
Mar 17, 2008
Sold by
Duah Mensah Robert and Duah Mensah Benedicta
Bought by
Hickey Abe Edward and Coogan Thomas Gerard
Home Financials for this Owner
Home Financials are based on the most recent Mortgage that was taken out on this home.
Original Mortgage
$179,000
Interest Rate
5.63%
Mortgage Type
Purchase Money Mortgage
Purchase Details
Closed on
Nov 25, 2002
Sold by
D R Horton Inc Torrey
Bought by
Duah Mensah Robert and Duah Mensah Benedicta
Home Financials for this Owner
Home Financials are based on the most recent Mortgage that was taken out on this home.
Original Mortgage
$144,622
Interest Rate
5.95%
Mortgage Type
FHA
Create a Home Valuation Report for This Property
The Home Valuation Report is an in-depth analysis detailing your home's value as well as a comparison with similar homes in the area
Home Values in the Area
Average Home Value in this Area
Purchase History
| Date | Buyer | Sale Price | Title Company |
|---|---|---|---|
| Hickey Abe Edward | -- | None Available | |
| Hickey Abe Edward | $179,000 | None Available | |
| Duah Mensah Robert | $147,000 | -- |
Source: Public Records
Mortgage History
| Date | Status | Borrower | Loan Amount |
|---|---|---|---|
| Previous Owner | Hickey Abe Edward | $179,000 | |
| Previous Owner | Duah Mensah Robert | $144,622 |
Source: Public Records
Tax History Compared to Growth
Tax History
| Year | Tax Paid | Tax Assessment Tax Assessment Total Assessment is a certain percentage of the fair market value that is determined by local assessors to be the total taxable value of land and additions on the property. | Land | Improvement |
|---|---|---|---|---|
| 2025 | $3,268 | $372,445 | $100,000 | $272,445 |
| 2024 | $3,255 | $372,445 | $100,000 | $272,445 |
| 2023 | $2,460 | $223,898 | $44,000 | $179,898 |
| 2022 | $2,287 | $223,898 | $44,000 | $179,898 |
| 2021 | $2,199 | $223,898 | $44,000 | $179,898 |
| 2020 | $2,159 | $223,898 | $44,000 | $179,898 |
| 2019 | $1,999 | $170,777 | $32,000 | $138,777 |
| 2018 | $1,886 | $170,777 | $32,000 | $138,777 |
| 2017 | $1,797 | $170,777 | $32,000 | $138,777 |
| 2016 | $1,760 | $170,777 | $32,000 | $138,777 |
| 2015 | $1,856 | $177,261 | $32,000 | $145,261 |
| 2014 | $1,760 | $177,261 | $32,000 | $145,261 |
Source: Public Records
Map
Nearby Homes
- 4208 Reddington Trail
- 4317 Woodlawn Dr
- 4508 Centrebrook Cir
- 4522 Centrebrook Cir
- 4217 James Rd
- 4106 N New Hope Rd
- 4200 James
- 4425 Woodlawn Dr
- 4721 Mocha Ln
- 4505 Woodlawn Dr
- 4604 Treadstone Ct
- 4604 Lavista Ct Unit A & B
- 4443 Antique Ln Unit D1
- 4809 Elmhurst Ridge Ct
- 4416 Major Loring Way
- 4500 Rivershyre Way
- 3936 Iron Horse Rd
- 3912 Summer Place
- 4809 Kaycee Ct
- 4809 Arbor Chase Dr
- 4208 Claybourne Dr
- 4429 Fawn Glen Dr
- 4436 Fawn Glen Dr
- 4432 Fawn Glen Dr
- 4213 Claybourne Dr
- 4204 Claybourne Dr
- 4217 Reddington Trail
- 4428 Fawn Glen Dr
- 4209 Claybourne Dr
- 4213 Reddington Trail
- 4209 Reddington Trail
- 4500 Fawn Glen Dr
- 4200 Claybourne Dr
- 4201 Claybourne Dr
- 4424 Fawn Glen Dr
- 4205 Claybourne Dr
- 4205 Reddington Trail
- 4504 Fawn Glen Dr
- 4509 Fawn Glen Dr
- 4420 Fawn Glen Dr