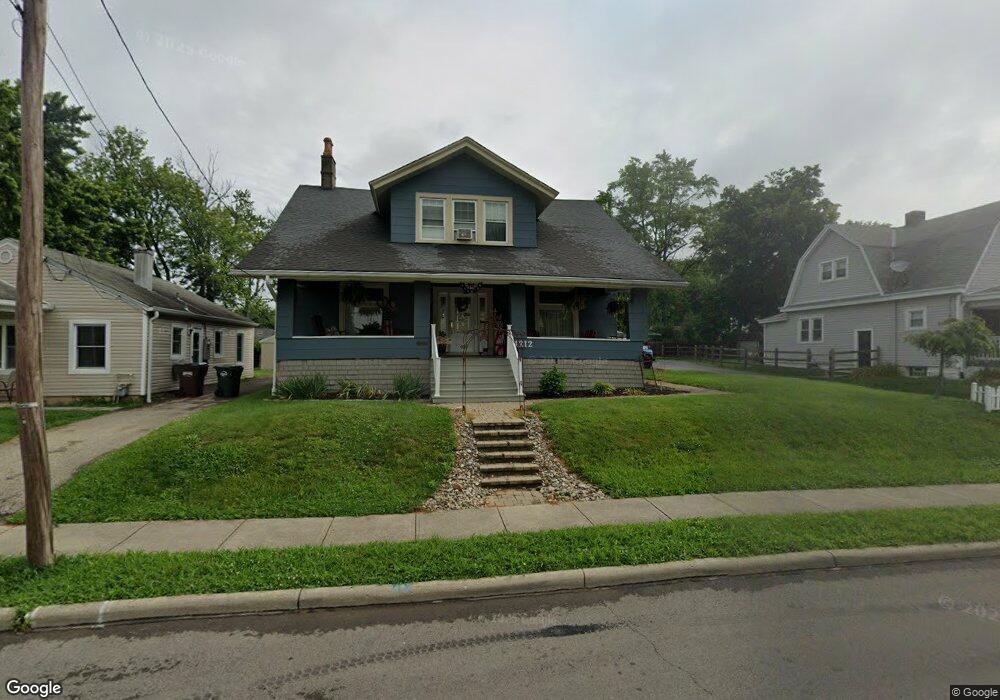
4212 Hegner Ave Cincinnati, OH 45236
Estimated Value: $279,000 - $320,000
3
Beds
2
Baths
1,814
Sq Ft
$164/Sq Ft
Est. Value
About This Home
This home is located at 4212 Hegner Ave, Cincinnati, OH 45236 and is currently estimated at $297,364, approximately $163 per square foot. 4212 Hegner Ave is a home located in Hamilton County with nearby schools including Amity Elementary School, Deer Park Jr/Sr High School, and Ohr Torah Cincinnati.
Ownership History
Date
Name
Owned For
Owner Type
Purchase Details
Closed on
Sep 15, 2016
Sold by
Collins David A
Bought by
Kimberly N Handley and Eugene E Handley
Current Estimated Value
Home Financials for this Owner
Home Financials are based on the most recent Mortgage that was taken out on this home.
Interest Rate
3.5%
Purchase Details
Closed on
Sep 8, 2016
Sold by
Collins David A and Collins Laverne D
Bought by
Handley Kimberly N and Handley Eugene E
Home Financials for this Owner
Home Financials are based on the most recent Mortgage that was taken out on this home.
Interest Rate
3.5%
Create a Home Valuation Report for This Property
The Home Valuation Report is an in-depth analysis detailing your home's value as well as a comparison with similar homes in the area
Home Values in the Area
Average Home Value in this Area
Purchase History
| Date | Buyer | Sale Price | Title Company |
|---|---|---|---|
| Kimberly N Handley | $127,000 | -- | |
| Handley Kimberly N | $381,500 | -- |
Source: Public Records
Mortgage History
| Date | Status | Borrower | Loan Amount |
|---|---|---|---|
| Closed | Kimberly N Handley | -- | |
| Open | Handley Kimberly N | $107,000 |
Source: Public Records
Tax History Compared to Growth
Tax History
| Year | Tax Paid | Tax Assessment Tax Assessment Total Assessment is a certain percentage of the fair market value that is determined by local assessors to be the total taxable value of land and additions on the property. | Land | Improvement |
|---|---|---|---|---|
| 2024 | $4,638 | $75,740 | $15,379 | $60,361 |
| 2023 | $4,726 | $75,740 | $15,379 | $60,361 |
| 2022 | $4,104 | $50,674 | $12,968 | $37,706 |
| 2021 | $4,019 | $50,674 | $12,968 | $37,706 |
| 2020 | $3,718 | $50,674 | $12,968 | $37,706 |
| 2019 | $3,627 | $44,450 | $11,375 | $33,075 |
| 2018 | $3,627 | $44,450 | $11,375 | $33,075 |
| 2017 | $3,455 | $44,450 | $11,375 | $33,075 |
| 2016 | $3,218 | $49,700 | $11,830 | $37,870 |
| 2015 | $2,942 | $49,700 | $11,830 | $37,870 |
| 2014 | $2,943 | $49,700 | $11,830 | $37,870 |
| 2013 | $2,838 | $47,789 | $11,375 | $36,414 |
Source: Public Records
Map
Nearby Homes
- 4106 Orchard Ln
- 4126 Orchard Ln
- 4279 Hegner Ave
- 7400 Plainfield Rd
- 7610 Blue Ash Rd
- 4040 Lansdowne Ave
- 4041 Lansdowne Ave
- 7215 Maryland Ave
- 4351 Clifford Rd
- 4248 South Ave
- 7195 Maryland Ave
- 7237 Virginia Ave
- 4250 Schenck Ave
- 7261 Garden Rd
- 4415 Duneden Ave
- 7212 Garden Rd
- 7833 Plainfield Rd
- 3841 Thornton Dr
- 7620 Montgomery Rd
- 3910 E Gatewood Ln
- 4208 Hegner Ave
- 4204 Hegner Ave
- 4216 Hegner Ave
- 4200 Hegner Ave
- 4220 Hegner Ave
- 4184 Hegner Ave
- 4201 Hegner Ave
- 4121 Orchard Ln
- 4117 Orchard Ln
- 7245 Brookline Ave
- 4125 Orchard Ln
- 4226 Hegner Ave
- 4207 Hegner Ave
- 4113 Orchard Ln
- 4205 Hegner Ave
- 4129 Orchard Ln
- 4109 Orchard Ln
- 7241 Brookline Ave
- 4133 Orchard Ln
- 4105 Orchard Ln