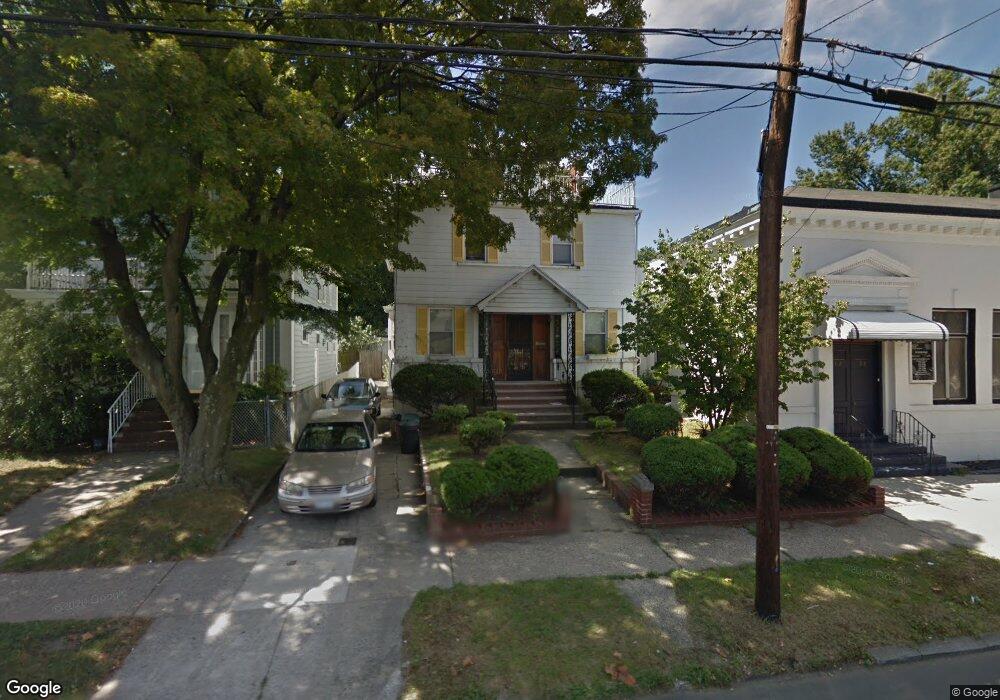
4212 Murray St Flushing, NY 11355
Flushing NeighborhoodEstimated Value: $1,390,000 - $1,622,000
--
Bed
--
Bath
2,945
Sq Ft
$506/Sq Ft
Est. Value
About This Home
This home is located at 4212 Murray St, Flushing, NY 11355 and is currently estimated at $1,490,433, approximately $506 per square foot. 4212 Murray St is a home located in Queens County with nearby schools including P.S. 22 - Thomas Jefferson, J.H.S. 189Q Daniel Carter Beard, and Flushing High School.
Ownership History
Date
Name
Owned For
Owner Type
Purchase Details
Closed on
Apr 13, 2001
Sold by
Chao Yuen Yu and Chan Yuen Hway
Bought by
Tsai Bi-Yun Lai
Current Estimated Value
Home Financials for this Owner
Home Financials are based on the most recent Mortgage that was taken out on this home.
Original Mortgage
$270,000
Outstanding Balance
$98,495
Interest Rate
6.88%
Estimated Equity
$1,391,938
Create a Home Valuation Report for This Property
The Home Valuation Report is an in-depth analysis detailing your home's value as well as a comparison with similar homes in the area
Home Values in the Area
Average Home Value in this Area
Purchase History
| Date | Buyer | Sale Price | Title Company |
|---|---|---|---|
| Tsai Bi-Yun Lai | -- | -- |
Source: Public Records
Mortgage History
| Date | Status | Borrower | Loan Amount |
|---|---|---|---|
| Open | Tsai Bi-Yun Lai | $270,000 |
Source: Public Records
Tax History Compared to Growth
Tax History
| Year | Tax Paid | Tax Assessment Tax Assessment Total Assessment is a certain percentage of the fair market value that is determined by local assessors to be the total taxable value of land and additions on the property. | Land | Improvement |
|---|---|---|---|---|
| 2025 | $9,822 | $53,315 | $12,656 | $40,659 |
| 2024 | $9,834 | $50,304 | $11,285 | $39,019 |
| 2023 | $9,255 | $47,477 | $9,094 | $38,383 |
| 2022 | $8,248 | $98,100 | $22,020 | $76,080 |
| 2021 | $9,205 | $100,740 | $22,020 | $78,720 |
| 2020 | $9,108 | $86,640 | $22,020 | $64,620 |
| 2019 | $8,476 | $79,500 | $22,020 | $57,480 |
| 2018 | $7,767 | $39,564 | $14,771 | $24,793 |
| 2017 | $7,369 | $37,621 | $14,205 | $23,416 |
| 2016 | $7,211 | $37,621 | $14,205 | $23,416 |
| 2015 | $4,061 | $37,024 | $20,922 | $16,102 |
| 2014 | $4,061 | $34,934 | $17,772 | $17,162 |
Source: Public Records
Map
Nearby Homes
- 149-63 Ash Ave
- 149-51 Ash Ave
- 154-21 Ash Ave
- 149-36 Ash Ave
- 14936 Ash Ave
- 150-23 Barclay Ave Unit 3H
- 150-23 Barclay Ave Unit 5A
- 150-23 Barclay Ave Unit 4H
- 41-50 149th Place Unit C2F
- 14917 Sanford Ave Unit 4A
- 155-17 Sanford Ave Unit 2
- 155-17 Sanford Ave Unit 2F
- 42-36 156th St
- 149-18 Cherry Ave
- 41-22 149th St
- 42-60 157th St Unit 3D
- 4307 149th St
- 147-45 Barclay Ave Unit 2
- 43-23 156th St
- 147-30 Barclay Ave Unit 3B
- 4216 Murray St
- 4208 Murray St
- 4222 Murray St
- 14964 Sanford Ave
- 14964 Sanford Ave
- 14963 Ash Ave
- 42-26 Murray St Unit 2nd Fl
- 14962 Sanford Ave
- 14961 Ash Ave
- 4226 Murray St
- 42-17 Murray St
- 14957 Ash Ave
- 149-57 Ash Ave
- 149-57 Ash Ave Unit 2 Fl
- 149-57 Ash Ave Unit 3Fl
- 42-23 Murray St
- 14954 Sanford Ave
- 14954 Sanford Ave
- 14955 Ash Ave
- 4205 Murray St