Estimated Value: $319,318 - $391,000
3
Beds
3
Baths
1,812
Sq Ft
$202/Sq Ft
Est. Value
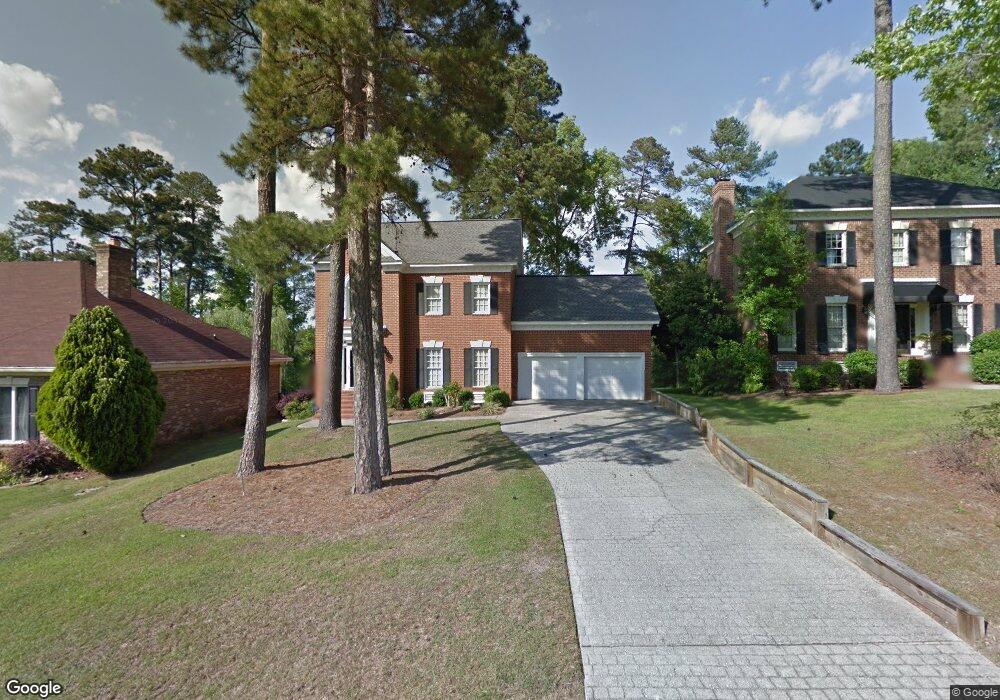
About This Home
This home is located at 4212 Park Chase Ct, Evans, GA 30809 and is currently estimated at $366,830, approximately $202 per square foot. 4212 Park Chase Ct is a home located in Columbia County with nearby schools including Northmore Elementary School, Lincoln Elementary School, and Blue Ridge Elementary School.
Ownership History
Date
Name
Owned For
Owner Type
Purchase Details
Closed on
Sep 13, 2010
Sold by
Layman Christina M
Bought by
Welbeck Vida
Current Estimated Value
Home Financials for this Owner
Home Financials are based on the most recent Mortgage that was taken out on this home.
Original Mortgage
$217,076
Outstanding Balance
$143,217
Interest Rate
4.5%
Mortgage Type
FHA
Estimated Equity
$223,613
Purchase Details
Closed on
Jan 11, 2006
Sold by
Herrington Benjamin
Bought by
Layman Christina M
Home Financials for this Owner
Home Financials are based on the most recent Mortgage that was taken out on this home.
Original Mortgage
$191,200
Interest Rate
5.77%
Mortgage Type
New Conventional
Purchase Details
Closed on
Oct 28, 2002
Sold by
Gleaton Charles H and Gleaton Cindy A
Bought by
Herrington Benjamin and Herrington Ramona
Home Financials for this Owner
Home Financials are based on the most recent Mortgage that was taken out on this home.
Original Mortgage
$148,000
Interest Rate
6.01%
Create a Home Valuation Report for This Property
The Home Valuation Report is an in-depth analysis detailing your home's value as well as a comparison with similar homes in the area
Home Values in the Area
Average Home Value in this Area
Purchase History
| Date | Buyer | Sale Price | Title Company |
|---|---|---|---|
| Welbeck Vida | $220,000 | -- | |
| Layman Christina M | $239,000 | -- | |
| Herrington Benjamin | $185,000 | -- |
Source: Public Records
Mortgage History
| Date | Status | Borrower | Loan Amount |
|---|---|---|---|
| Open | Welbeck Vida | $217,076 | |
| Previous Owner | Layman Christina M | $191,200 | |
| Previous Owner | Herrington Benjamin | $148,000 | |
| Closed | Herrington Benjamin | $27,750 |
Source: Public Records
Tax History Compared to Growth
Tax History
| Year | Tax Paid | Tax Assessment Tax Assessment Total Assessment is a certain percentage of the fair market value that is determined by local assessors to be the total taxable value of land and additions on the property. | Land | Improvement |
|---|---|---|---|---|
| 2025 | $3,304 | $136,113 | $27,604 | $108,509 |
| 2024 | $2,993 | $117,456 | $24,404 | $93,052 |
| 2023 | $2,993 | $104,531 | $23,104 | $81,427 |
| 2022 | $2,719 | $102,403 | $21,204 | $81,199 |
| 2021 | $2,743 | $98,741 | $39,204 | $59,537 |
| 2020 | $2,670 | $94,063 | $36,804 | $57,259 |
| 2019 | $2,597 | $91,433 | $36,804 | $54,629 |
| 2018 | $2,714 | $95,338 | $40,804 | $54,534 |
| 2017 | $2,735 | $95,764 | $34,404 | $61,360 |
| 2016 | $2,630 | $95,412 | $36,180 | $59,232 |
| 2015 | $2,331 | $84,168 | $31,580 | $52,588 |
| 2014 | $2,277 | $81,122 | $31,580 | $49,542 |
Source: Public Records
Map
Nearby Homes
- 612 Emerald Crossing
- 4305 Southern Pines Dr
- 1062 Emerald Place
- 1013 Emerald Place
- 628 Emerald Crossing
- 701 Fosters Ct
- 644 Emerald Crossing
- 4172 Tindall Dr
- 516 McKinnes Park
- 839 Prairie Ln
- 579 Litchfield Ct
- 4190 Litchfield Ln
- 1009 Barrett Dr
- 598 Bradford Ln
- 936 Deercrest Cir
- 536 Laniers Way
- 4277 Deerwood Ln
- 4209 Fairfield Cir
- 303 N Sandhills Ln
- 0 Commons Dr
- 4210 Park Chase Ct
- 4214 Park Chase Ct
- 4208 Park Chase Ct
- 837 Park Chase Dr
- 841 Park Chase Dr
- 835 Park Chase Dr
- 4209 Park Chase Ct
- 833 Park Chase Dr
- 4211 Park Chase Ct
- 843 Park Chase Dr
- 831 Park Chase Dr
- 836 Park Chase Dr
- 845 Park Chase Dr
- 840 Park Chase Dr
- 842 Park Chase Dr
- 838 Park Chase Dr
- 844 Park Chase Dr
- 829 Park Chase Dr
- 4311 Southern Pines Dr
- 847 Park Chase Dr