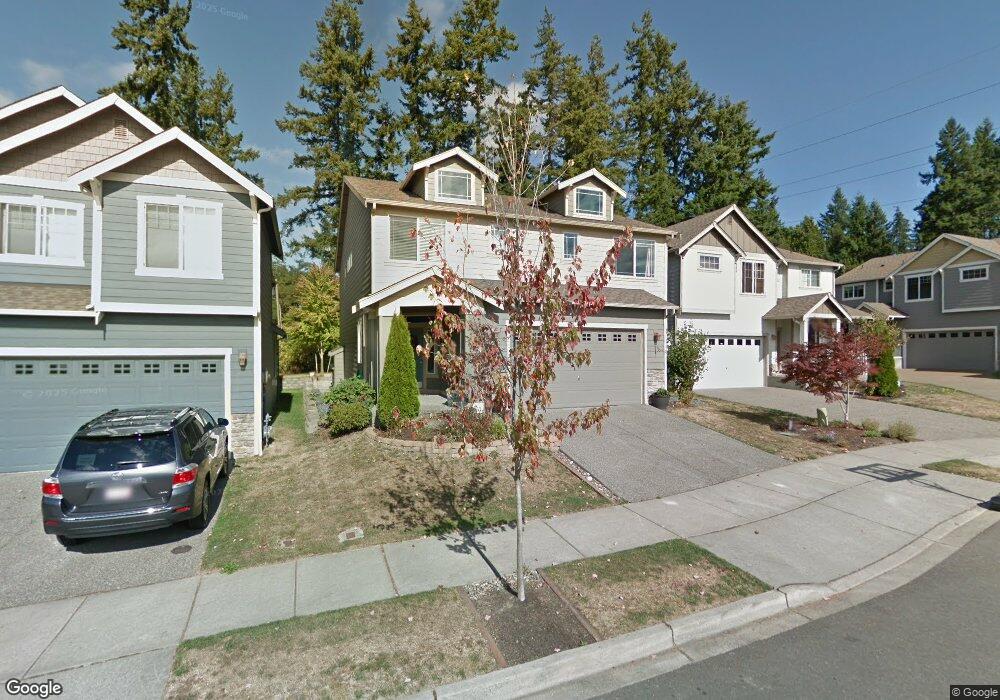
4213 164th Place SE Unit 10 Bothell, WA 98012
Estimated Value: $1,086,000 - $1,212,000
3
Beds
4
Baths
2,396
Sq Ft
$471/Sq Ft
Est. Value
About This Home
This home is located at 4213 164th Place SE Unit 10, Bothell, WA 98012 and is currently estimated at $1,128,795, approximately $471 per square foot. 4213 164th Place SE Unit 10 is a home located in Snohomish County with nearby schools including Tambark Creek Elementary School, Gateway Middle School, and Henry M. Jackson High School.
Ownership History
Date
Name
Owned For
Owner Type
Purchase Details
Closed on
Jul 16, 2018
Sold by
Cushing Kari L
Bought by
Mattu Pankaj and Mattu Archana
Current Estimated Value
Home Financials for this Owner
Home Financials are based on the most recent Mortgage that was taken out on this home.
Original Mortgage
$641,250
Outstanding Balance
$556,968
Interest Rate
4.6%
Mortgage Type
New Conventional
Estimated Equity
$571,827
Purchase Details
Closed on
May 29, 2008
Sold by
Regent Homes Inc
Bought by
Cushing Kari L
Home Financials for this Owner
Home Financials are based on the most recent Mortgage that was taken out on this home.
Original Mortgage
$413,511
Interest Rate
5.87%
Mortgage Type
FHA
Create a Home Valuation Report for This Property
The Home Valuation Report is an in-depth analysis detailing your home's value as well as a comparison with similar homes in the area
Home Values in the Area
Average Home Value in this Area
Purchase History
| Date | Buyer | Sale Price | Title Company |
|---|---|---|---|
| Mattu Pankaj | $675,000 | Old Republic Title Ltd | |
| Cushing Kari L | $420,000 | Chicago Title |
Source: Public Records
Mortgage History
| Date | Status | Borrower | Loan Amount |
|---|---|---|---|
| Open | Mattu Pankaj | $641,250 | |
| Previous Owner | Cushing Kari L | $413,511 |
Source: Public Records
Tax History Compared to Growth
Tax History
| Year | Tax Paid | Tax Assessment Tax Assessment Total Assessment is a certain percentage of the fair market value that is determined by local assessors to be the total taxable value of land and additions on the property. | Land | Improvement |
|---|---|---|---|---|
| 2025 | $8,482 | $912,300 | $570,000 | $342,300 |
| 2024 | $8,482 | $900,400 | $570,000 | $330,400 |
| 2023 | $8,674 | $1,010,100 | $630,000 | $380,100 |
| 2022 | $6,637 | $667,600 | $345,000 | $322,600 |
| 2020 | $7,004 | $592,100 | $315,000 | $277,100 |
| 2019 | $6,469 | $548,700 | $260,000 | $288,700 |
| 2018 | $6,183 | $477,600 | $220,000 | $257,600 |
| 2017 | $5,323 | $414,300 | $172,000 | $242,300 |
| 2016 | $4,888 | $392,100 | $160,000 | $232,100 |
| 2015 | $4,806 | $365,500 | $137,000 | $228,500 |
| 2013 | $4,068 | $273,100 | $100,000 | $173,100 |
Source: Public Records
Map
Nearby Homes
- 16519 37th Dr SE
- 16910 40th Ave SE
- 3701 170th Place SE
- 16119 35th Dr SE
- KIMBALL Plan at Tambark Estates
- 16606 35th Ave SE Unit 9A
- 4111 174th St SE
- 4115 176th Place SE
- 4714 175th St SE
- 15901 30th Dr SE
- 16008 30th Dr SE
- 3918 177th St SE
- 4620 151st Place SE
- 3504 Seattle Hill Rd Unit 30
- 14915 38th Dr SE Unit JJ1180
- 14915 38th Dr SE Unit S1148
- 14915 38th Dr SE Unit S1146
- 14915 38th Dr SE Unit 2049
- 4012 147th Place SE
- 3410 165th St SE
- 4213 164th Place SE
- 4217 164th Place SE
- 4217 164th Place SE Unit 11
- 4209 164th Place SE
- 4209 164th Place SE Unit 9
- 4205 164th Place SE
- 4205 164th Place SE Unit 8
- 4221 164th Place SE
- 4221 164th Place SE Unit 12
- 16415 42nd Dr SE
- 4214 164th Place SE Unit 50
- 4214 164th Place SE
- 4201 164th Place SE
- 4201 164th Place SE Unit 7
- 16419 42nd Dr SE
- 4210 164th Place SE Unit 49
- 4210 164th Place SE
- 16325 Sunset Rd
- 16416 42nd Ave SE
- 16416 42nd Ave SE Unit 6