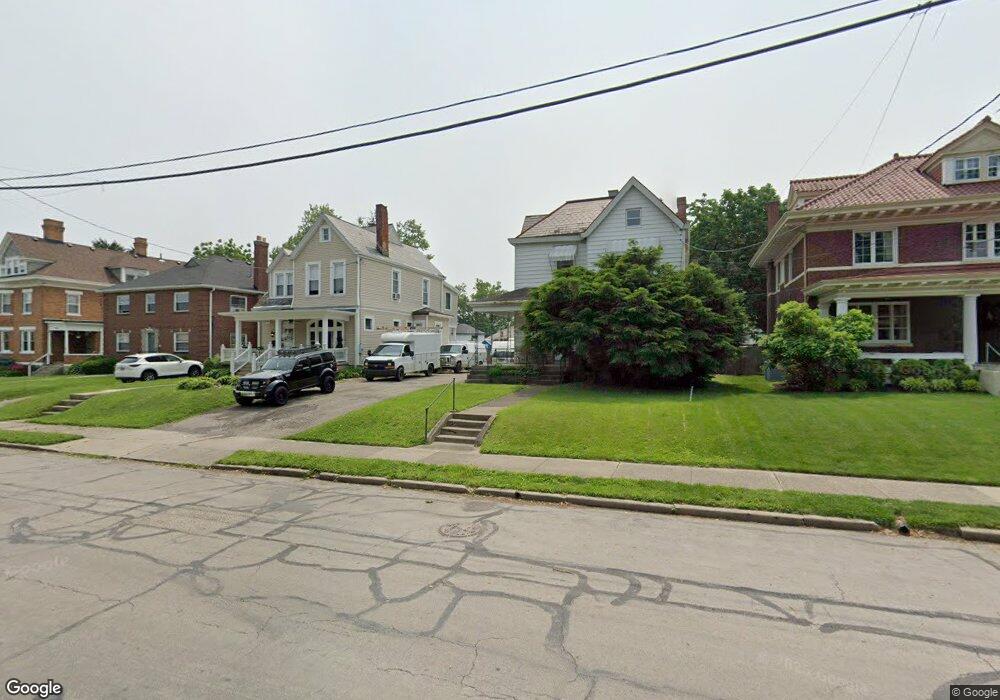
4214 Forest Ave Unit 30 Cincinnati, OH 45212
Estimated Value: $347,000 - $422,000
3
Beds
1
Bath
1,380
Sq Ft
$279/Sq Ft
Est. Value
About This Home
This home is located at 4214 Forest Ave Unit 30, Cincinnati, OH 45212 and is currently estimated at $384,798, approximately $278 per square foot. 4214 Forest Ave Unit 30 is a home located in Hamilton County with nearby schools including Norwood High School, Cornerstone Christian Academy, and Immaculate Conception Academy.
Ownership History
Date
Name
Owned For
Owner Type
Purchase Details
Closed on
Mar 25, 2003
Sold by
Wean Anthony R and Sauteret Sophie Sauteret
Bought by
Hermes Franz Josef and Hermes Kimberly A
Current Estimated Value
Home Financials for this Owner
Home Financials are based on the most recent Mortgage that was taken out on this home.
Original Mortgage
$131,200
Outstanding Balance
$56,650
Interest Rate
5.94%
Estimated Equity
$328,148
Purchase Details
Closed on
Jul 29, 1994
Sold by
Strasser Dean E and Strasser Joann M
Bought by
Wean Anthony R and Wean Sophie Sauteret
Home Financials for this Owner
Home Financials are based on the most recent Mortgage that was taken out on this home.
Original Mortgage
$82,900
Interest Rate
8.53%
Create a Home Valuation Report for This Property
The Home Valuation Report is an in-depth analysis detailing your home's value as well as a comparison with similar homes in the area
Home Values in the Area
Average Home Value in this Area
Purchase History
| Date | Buyer | Sale Price | Title Company |
|---|---|---|---|
| Hermes Franz Josef | $164,000 | -- | |
| Wean Anthony R | -- | -- |
Source: Public Records
Mortgage History
| Date | Status | Borrower | Loan Amount |
|---|---|---|---|
| Open | Hermes Franz Josef | $131,200 | |
| Closed | Wean Anthony R | $82,900 | |
| Closed | Hermes Franz Josef | $24,600 |
Source: Public Records
Tax History Compared to Growth
Tax History
| Year | Tax Paid | Tax Assessment Tax Assessment Total Assessment is a certain percentage of the fair market value that is determined by local assessors to be the total taxable value of land and additions on the property. | Land | Improvement |
|---|---|---|---|---|
| 2024 | $5,451 | $91,074 | $38,798 | $52,276 |
| 2023 | $5,570 | $91,074 | $38,798 | $52,276 |
| 2022 | $5,436 | $79,787 | $23,272 | $56,515 |
| 2021 | $5,232 | $79,787 | $23,272 | $56,515 |
| 2020 | $5,383 | $79,787 | $23,272 | $56,515 |
| 2019 | $4,906 | $66,490 | $19,394 | $47,096 |
| 2018 | $4,913 | $66,490 | $19,394 | $47,096 |
| 2017 | $4,669 | $66,490 | $19,394 | $47,096 |
| 2016 | $4,006 | $56,169 | $14,739 | $41,430 |
| 2015 | $3,610 | $56,169 | $14,739 | $41,430 |
| 2014 | $3,636 | $56,169 | $14,739 | $41,430 |
| 2013 | $3,394 | $51,531 | $13,521 | $38,010 |
Source: Public Records
Map
Nearby Homes
- 2517 Marsh Ave
- 4317 Smith Rd
- 4308 Smith Rd
- 4026 Grove Ave
- 4010 S Jefferson Ave
- 3939 Grove Ave
- 3937 Grove Ave
- 2409 Kenilworth Ave
- 2215 Jefferson Ave
- 4569 Smith Rd
- 2620 Melrose Ave
- 3923 S Madison Ave
- 2217 Monroe Ave
- 4402 Lafayette Ave
- 4111 Elsmere Ave
- 3950 Elsmere Ave
- 4206 Lafayette Ave
- 2726 Ida Ave
- 3790 Grovedale Place
- 2418 Morton Ave
- 4218 Forest Ave Unit THIRTY
- 4226 Forest Ave Unit 30
- 4221 Forest Ave Unit THIRTY
- 4212 Forest Ave
- 4220 Forest Ave Unit 30
- 4220 Forest Ave Unit 30
- 4213 Forest Ave Unit THIRTY
- 4210 Forest Ave Unit THIRTY
- 4216 Forest Ave
- 4216 Forest Ave Unit THIRTY
- 4219 Forest Ave
- 4219 Forest Ave Unit 30
- 4209 Forest Ave Unit THIRTY
- 4208 Forest Ave
- 4208 Forest Ave Unit 30
- 4222 Forest Ave Unit THIRTY
- 4217 Forest Ave Unit 30
- 4217 Forest Ave
- 4217 Forest Ave Unit 30
- 4228 Forest Ave Unit THIRTY