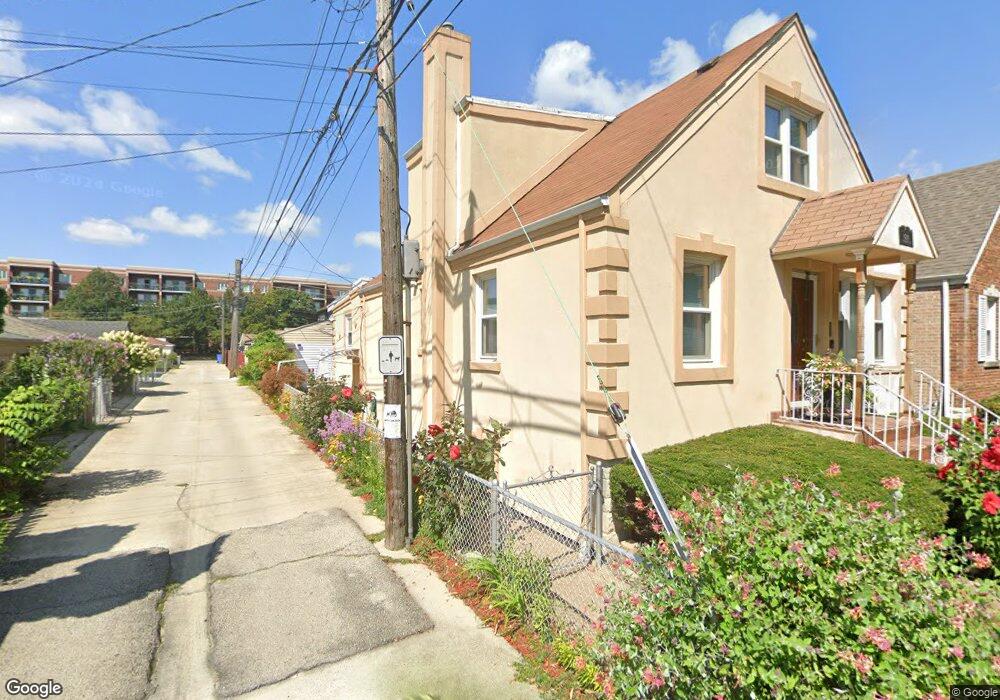
4214 N Mulligan Ave Chicago, IL 60634
Portage Park NeighborhoodEstimated Value: $374,000 - $452,000
4
Beds
2
Baths
768
Sq Ft
$542/Sq Ft
Est. Value
About This Home
This home is located at 4214 N Mulligan Ave, Chicago, IL 60634 and is currently estimated at $416,156, approximately $541 per square foot. 4214 N Mulligan Ave is a home located in Cook County with nearby schools including Smyser Elementary School, William Howard Taft High School, and Pope Francis Global Academy.
Ownership History
Date
Name
Owned For
Owner Type
Purchase Details
Closed on
Jul 19, 2001
Sold by
Espana Hector E and Espana Emilia
Bought by
Landeros Hector H and Landeros Maria E
Current Estimated Value
Home Financials for this Owner
Home Financials are based on the most recent Mortgage that was taken out on this home.
Original Mortgage
$229,491
Outstanding Balance
$88,568
Interest Rate
7.16%
Mortgage Type
FHA
Estimated Equity
$327,588
Purchase Details
Closed on
Jun 30, 1999
Sold by
Dahlin Lois J
Bought by
Espana Hector E and Espana Emilia
Home Financials for this Owner
Home Financials are based on the most recent Mortgage that was taken out on this home.
Original Mortgage
$163,200
Interest Rate
7.43%
Purchase Details
Closed on
May 19, 1994
Sold by
Dahlin Kenneth R and Dahlin Lois J
Bought by
Dahlin Lois J
Create a Home Valuation Report for This Property
The Home Valuation Report is an in-depth analysis detailing your home's value as well as a comparison with similar homes in the area
Home Values in the Area
Average Home Value in this Area
Purchase History
| Date | Buyer | Sale Price | Title Company |
|---|---|---|---|
| Landeros Hector H | $238,000 | -- | |
| Espana Hector E | $192,000 | Heritage Title Co | |
| Dahlin Lois J | -- | -- |
Source: Public Records
Mortgage History
| Date | Status | Borrower | Loan Amount |
|---|---|---|---|
| Open | Landeros Hector H | $229,491 | |
| Previous Owner | Espana Hector E | $163,200 |
Source: Public Records
Tax History Compared to Growth
Tax History
| Year | Tax Paid | Tax Assessment Tax Assessment Total Assessment is a certain percentage of the fair market value that is determined by local assessors to be the total taxable value of land and additions on the property. | Land | Improvement |
|---|---|---|---|---|
| 2024 | $4,649 | $29,001 | $14,438 | $14,563 |
| 2023 | $4,493 | $28,000 | $11,550 | $16,450 |
| 2022 | $4,493 | $28,000 | $11,550 | $16,450 |
| 2021 | $5,631 | $28,000 | $11,550 | $16,450 |
| 2020 | $4,549 | $20,422 | $5,156 | $15,266 |
| 2019 | $4,610 | $22,947 | $5,156 | $17,791 |
| 2018 | $4,533 | $22,947 | $5,156 | $17,791 |
| 2017 | $4,437 | $20,611 | $4,537 | $16,074 |
| 2016 | $3,271 | $20,611 | $4,537 | $16,074 |
| 2015 | $3,296 | $20,611 | $4,537 | $16,074 |
| 2014 | $3,402 | $20,902 | $4,125 | $16,777 |
| 2013 | $3,323 | $20,902 | $4,125 | $16,777 |
Source: Public Records
Map
Nearby Homes
- 6248 W Berteau Ave
- 6400 W Belle Plaine Ave Unit 303
- 4305 N Mobile Ave
- 4103 N Narragansett Ave
- 4106 N Mobile Ave
- 6430 W Belle Plaine Ave Unit 307
- 4106 N Narragansett Ave Unit 301
- 6450 W Berteau Ave Unit 201
- 6460 W Belle Plaine Ave Unit 407
- 6455 W Belle Plaine Ave Unit 410
- 6455 W Belle Plaine Ave Unit 208
- 4210 N Moody Ave
- 4052 N Melvina Ave
- 6450 W Montrose Ave
- 4433 N Narragansett Ave
- 4039 N Melvina Ave
- 6540 W Irving Park Rd Unit 603
- 4447 N Merrimac Ave
- 4442 N Melvina Ave
- 4119 N Meade Ave
- 4216 N Mulligan Ave
- 4220 N Mulligan Ave
- 4220 N Mulligan Ave
- 6338 W Berteau Ave
- 4222 N Mulligan Ave
- 4222 N Mulligan Ave Unit 1
- 4222 N Mulligan Ave Unit 2
- 4222 N Mulligan Ave
- 6340 W Berteau Ave
- 6334 W Berteau Ave
- 6344 W Berteau Ave
- 4226 N Mulligan Ave
- 6346 W Berteau Ave
- 4215 N Narragansett Ave
- 6350 W Berteau Ave
- 4230 N Mulligan Ave
- 6324 W Berteau Ave
- 4217 N Narragansett Ave
- 4225 N Narragansett Ave
- 4221 N Narragansett Ave