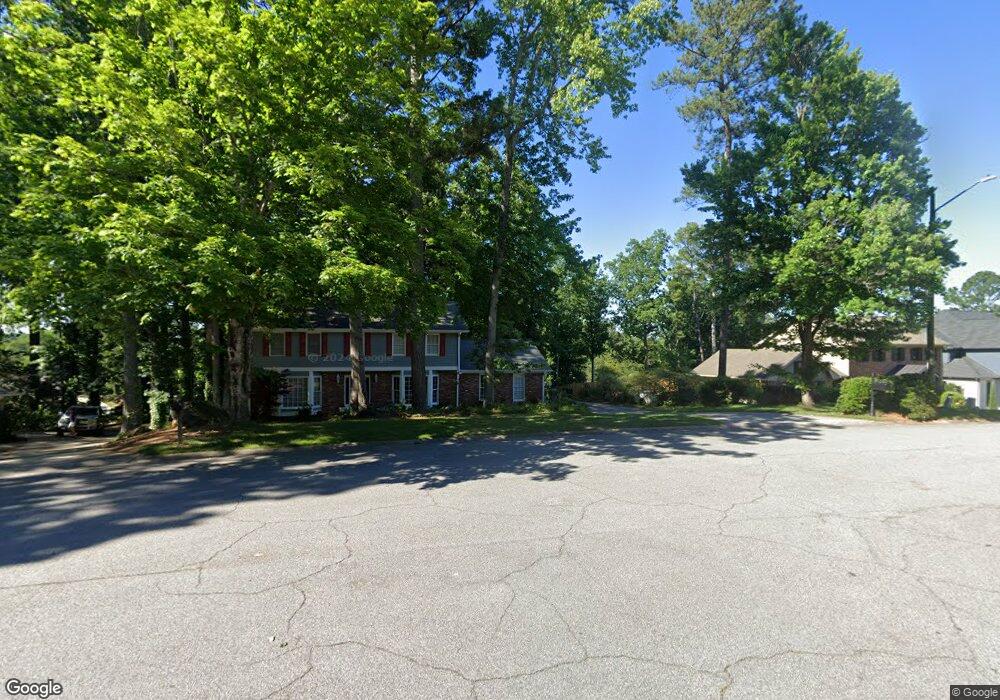
4215 Edgewood Ct Unit 9 Marietta, GA 30068
Indian Hills Country Club NeighborhoodEstimated Value: $763,000 - $1,252,526
4
Beds
4
Baths
2,425
Sq Ft
$412/Sq Ft
Est. Value
About This Home
This home is located at 4215 Edgewood Ct Unit 9, Marietta, GA 30068 and is currently estimated at $998,132, approximately $411 per square foot. 4215 Edgewood Ct Unit 9 is a home located in Cobb County with nearby schools including East Side Elementary School, Dickerson Middle School, and Walton High School.
Ownership History
Date
Name
Owned For
Owner Type
Purchase Details
Closed on
Jul 6, 2020
Sold by
Levine Henry P and Levine Janice R
Bought by
Levine Henry P and Levine Janice R
Current Estimated Value
Home Financials for this Owner
Home Financials are based on the most recent Mortgage that was taken out on this home.
Original Mortgage
$213,000
Outstanding Balance
$186,989
Interest Rate
2.9%
Mortgage Type
New Conventional
Estimated Equity
$811,143
Purchase Details
Closed on
Jul 22, 2016
Sold by
Henry P
Bought by
Levine Liv Trust
Purchase Details
Closed on
Jun 25, 1998
Sold by
Lerner Wm and Lerner Diana P
Bought by
Levine Henry P and Levine Janice
Home Financials for this Owner
Home Financials are based on the most recent Mortgage that was taken out on this home.
Original Mortgage
$180,700
Interest Rate
7.21%
Mortgage Type
New Conventional
Create a Home Valuation Report for This Property
The Home Valuation Report is an in-depth analysis detailing your home's value as well as a comparison with similar homes in the area
Home Values in the Area
Average Home Value in this Area
Purchase History
| Date | Buyer | Sale Price | Title Company |
|---|---|---|---|
| Levine Henry P | -- | Amrock Inc | |
| Levine Henry | -- | Amrock Inc | |
| Levine Liv Trust | -- | -- | |
| Levine Henry P | $225,900 | -- |
Source: Public Records
Mortgage History
| Date | Status | Borrower | Loan Amount |
|---|---|---|---|
| Open | Levine Henry | $213,000 | |
| Previous Owner | Levine Henry P | $180,700 |
Source: Public Records
Tax History Compared to Growth
Tax History
| Year | Tax Paid | Tax Assessment Tax Assessment Total Assessment is a certain percentage of the fair market value that is determined by local assessors to be the total taxable value of land and additions on the property. | Land | Improvement |
|---|---|---|---|---|
| 2024 | $1,329 | $217,244 | $70,000 | $147,244 |
| 2023 | $1,067 | $198,388 | $60,000 | $138,388 |
| 2022 | $1,280 | $200,624 | $60,000 | $140,624 |
| 2021 | $1,210 | $177,372 | $60,000 | $117,372 |
| 2020 | $1,234 | $185,264 | $60,000 | $125,264 |
| 2019 | $1,234 | $185,264 | $60,000 | $125,264 |
| 2018 | $1,155 | $159,060 | $46,400 | $112,660 |
| 2017 | $1,035 | $159,060 | $46,400 | $112,660 |
| 2016 | $981 | $139,620 | $44,000 | $95,620 |
| 2015 | $969 | $115,252 | $32,000 | $83,252 |
| 2014 | $990 | $115,252 | $0 | $0 |
Source: Public Records
Map
Nearby Homes
- 4002 Edgewood Ct Unit 9
- 4232 Edgewood Ct
- 4250 Summit Dr
- 4201 Fairgreen Terrace NE
- 4096 Audubon Dr Unit 4096
- 786 Fairfield Dr
- 870 Muirfield Trace
- 575 Indian Hills Pkwy
- 4037 Fawn Run
- 3948 Cliffmont Cir
- 1164 Fairfield Dr
- 633 Cagle Rd
- 3830 Valley Green Dr
- 411 Woodstone Dr W
- 1097 Princeton Walk NE Unit 1A
- 4420 Nassau Way NE
- 3760 Creekstone Way
- 4528 Lashley Ct NE
- 4223 Edgewood Ct
- 4213 Edgewood Ct
- 0 Edgewood Ct Unit 7580999
- 0 Edgewood Ct Unit 7496491
- 0 Edgewood Ct Unit 8687468
- 0 Edgewood Ct Unit 8561985
- 0 Edgewood Ct Unit 8342470
- 826 Hillwood Dr
- 836 Hillwood Dr
- 4233 Edgewood Ct
- 816 Hillwood Dr
- 4222 Edgewood Ct
- 806 Hillwood Dr Unit 9
- 4212 Edgewood Ct
- 4321 Summit Dr
- 796 Hillwood Dr
- 0 Hillwood Dr Unit 7512714
- 0 Hillwood Dr Unit 3279905
- 0 Hillwood Dr Unit 8824110
- 0 Hillwood Dr Unit 8743820