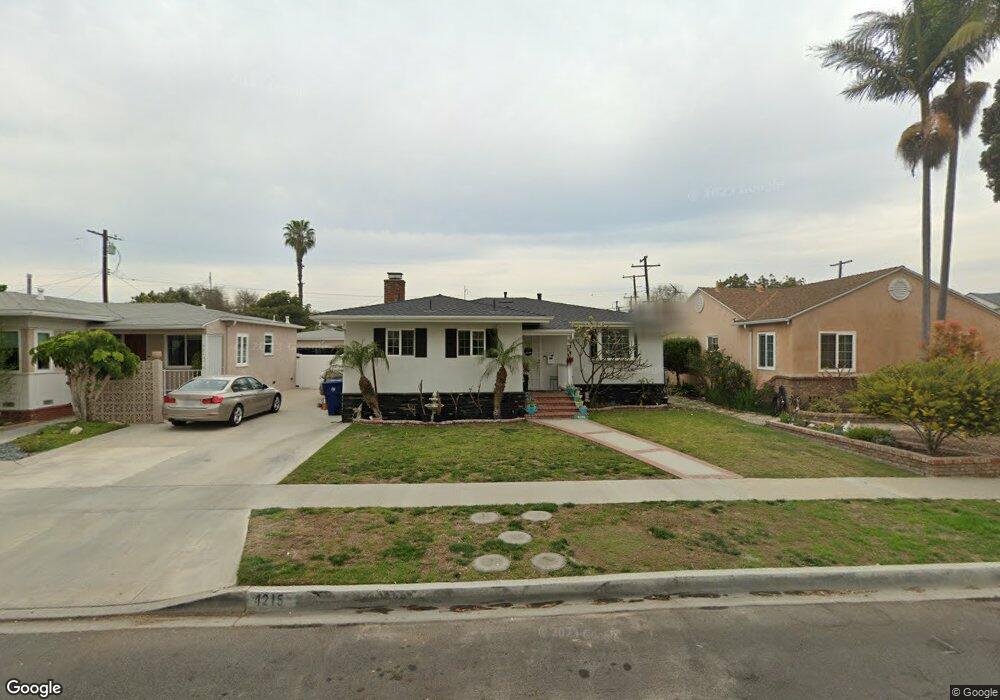
4215 W 173rd St Torrance, CA 90504
North Torrance NeighborhoodEstimated Value: $987,000 - $1,154,000
3
Beds
1
Bath
1,139
Sq Ft
$924/Sq Ft
Est. Value
About This Home
This home is located at 4215 W 173rd St, Torrance, CA 90504 and is currently estimated at $1,052,916, approximately $924 per square foot. 4215 W 173rd St is a home located in Los Angeles County with nearby schools including Evelyn Carr Elementary School, Philip Magruder Middle School, and North High School.
Ownership History
Date
Name
Owned For
Owner Type
Purchase Details
Closed on
Mar 14, 2003
Sold by
Deziel Julie
Bought by
Deziel Josh A
Current Estimated Value
Home Financials for this Owner
Home Financials are based on the most recent Mortgage that was taken out on this home.
Original Mortgage
$273,750
Outstanding Balance
$116,911
Interest Rate
5.79%
Estimated Equity
$936,005
Purchase Details
Closed on
Dec 10, 2001
Sold by
Deziel Josh
Bought by
Deziel Julie
Home Financials for this Owner
Home Financials are based on the most recent Mortgage that was taken out on this home.
Original Mortgage
$210,000
Interest Rate
6.57%
Purchase Details
Closed on
Nov 9, 2001
Sold by
Hodges Deborah K and Estate Of Betty J Anderson
Bought by
Deziel Josh
Home Financials for this Owner
Home Financials are based on the most recent Mortgage that was taken out on this home.
Original Mortgage
$210,000
Interest Rate
6.57%
Create a Home Valuation Report for This Property
The Home Valuation Report is an in-depth analysis detailing your home's value as well as a comparison with similar homes in the area
Home Values in the Area
Average Home Value in this Area
Purchase History
| Date | Buyer | Sale Price | Title Company |
|---|---|---|---|
| Deziel Josh A | -- | Fidelity National Title Co | |
| Deziel Julie | -- | First American Title Co | |
| Deziel Josh | $262,500 | First American Title Co |
Source: Public Records
Mortgage History
| Date | Status | Borrower | Loan Amount |
|---|---|---|---|
| Open | Deziel Josh A | $273,750 | |
| Closed | Deziel Josh | $210,000 | |
| Closed | Deziel Josh | $39,300 |
Source: Public Records
Tax History Compared to Growth
Tax History
| Year | Tax Paid | Tax Assessment Tax Assessment Total Assessment is a certain percentage of the fair market value that is determined by local assessors to be the total taxable value of land and additions on the property. | Land | Improvement |
|---|---|---|---|---|
| 2025 | $5,528 | $478,482 | $354,539 | $123,943 |
| 2024 | $5,528 | $469,101 | $347,588 | $121,513 |
| 2023 | $5,428 | $459,904 | $340,773 | $119,131 |
| 2022 | $5,354 | $450,888 | $334,092 | $116,796 |
| 2021 | $4,651 | $388,948 | $327,542 | $61,406 |
| 2019 | $4,517 | $377,414 | $317,828 | $59,586 |
| 2018 | $4,349 | $370,015 | $311,597 | $58,418 |
| 2016 | $4,151 | $355,649 | $299,499 | $56,150 |
| 2015 | $4,060 | $350,308 | $295,001 | $55,307 |
| 2014 | $3,959 | $343,447 | $289,223 | $54,224 |
Source: Public Records
Map
Nearby Homes
- 4223 Artesia Blvd
- 4114 Artesia Blvd
- 4147 W 172nd St
- 4019 W 176th St
- 3838 W 176th Ct
- 4300 W 165th St
- 3813 W 173rd St
- 4600 W 170th St
- 4325 W 182nd St Unit 18
- North Pointe Plan at North Pointe
- 17805 Florwood Ave
- 17234 Condon Ave
- 2750 Artesia Blvd Unit 364
- 17022 Condon Ave
- 4001 W 165th St Unit A
- 4003 W 165th St Unit G
- 17405 Kornblum Ave
- 4101 W 184th St
- 4706 W 168th St
- 4522 W 164th St
- 4211 W 173rd St
- 4219 W 173rd St
- 4223 W 173rd St
- 4207 W 173rd St
- 4220 W 172nd St
- 4227 W 173rd St
- 17209 Amie Ave
- 4216 W 173rd St
- 4212 W 173rd St
- 17213 Amie Ave
- 17317 Amie Ave
- 4232 W 172nd St
- 17217 Amie Ave
- 4220 W 173rd St
- 4214 W 172nd St
- 17205 Amie Ave
- 4224 W 173rd St
- 17311 Amie Ave
- 4208 W 172nd St
- 4228 W 173rd St