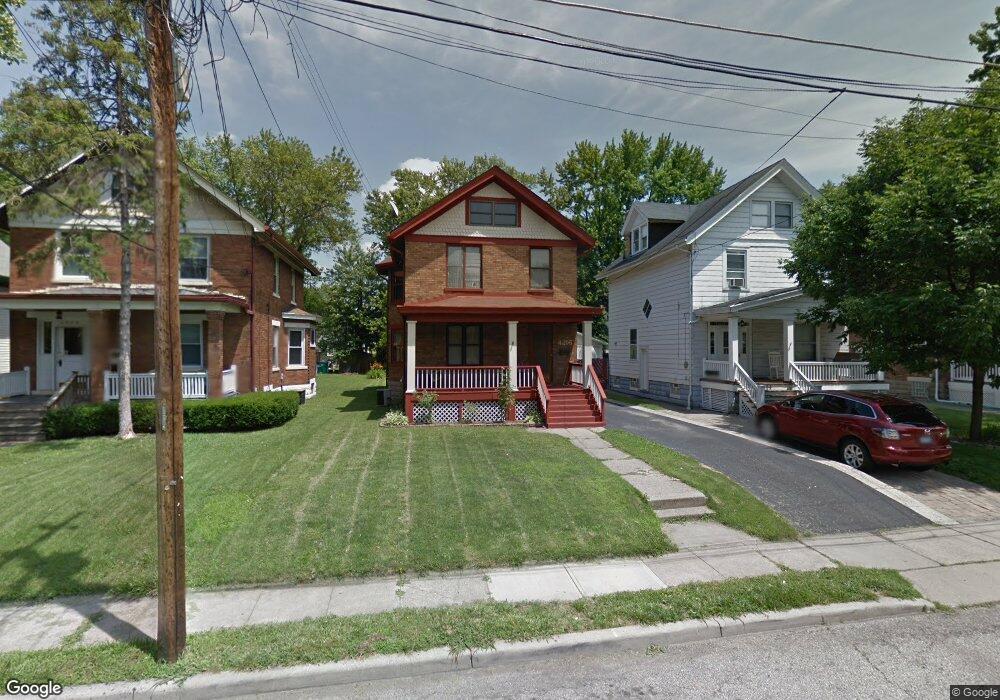
4216 33rd Ave Cincinnati, OH 45209
Oakley NeighborhoodEstimated Value: $366,000 - $453,000
3
Beds
1
Bath
1,673
Sq Ft
$240/Sq Ft
Est. Value
About This Home
This home is located at 4216 33rd Ave, Cincinnati, OH 45209 and is currently estimated at $402,172, approximately $240 per square foot. 4216 33rd Ave is a home located in Hamilton County with nearby schools including Withrow University High School, Clark Montessori High School, and Shroder High School.
Ownership History
Date
Name
Owned For
Owner Type
Purchase Details
Closed on
Oct 13, 2021
Sold by
R 2 R Investments Llc
Bought by
Robinson Christopher J and Robinson Ellen M
Current Estimated Value
Home Financials for this Owner
Home Financials are based on the most recent Mortgage that was taken out on this home.
Original Mortgage
$200,500
Outstanding Balance
$181,243
Interest Rate
2.8%
Mortgage Type
Future Advance Clause Open End Mortgage
Estimated Equity
$220,929
Purchase Details
Closed on
Sep 10, 2021
Sold by
Bodge Eric
Bought by
R 2 R Investments Llc
Home Financials for this Owner
Home Financials are based on the most recent Mortgage that was taken out on this home.
Original Mortgage
$200,500
Outstanding Balance
$181,243
Interest Rate
2.8%
Mortgage Type
Future Advance Clause Open End Mortgage
Estimated Equity
$220,929
Purchase Details
Closed on
May 9, 2018
Sold by
Maria Mcgarey
Bought by
Bodge Eric
Home Financials for this Owner
Home Financials are based on the most recent Mortgage that was taken out on this home.
Original Mortgage
$252,900
Interest Rate
4.55%
Purchase Details
Closed on
May 3, 2018
Sold by
Sanker Maria
Bought by
Bodge Eric
Home Financials for this Owner
Home Financials are based on the most recent Mortgage that was taken out on this home.
Original Mortgage
$252,900
Interest Rate
4.55%
Purchase Details
Closed on
Jun 1, 2011
Sold by
Surface Bryan R and Surface Kimberly
Bought by
Sanker Maria and Mcgarcey Benjamin H
Home Financials for this Owner
Home Financials are based on the most recent Mortgage that was taken out on this home.
Original Mortgage
$172,513
Interest Rate
3.37%
Mortgage Type
FHA
Purchase Details
Closed on
Oct 8, 2004
Sold by
Weintz Christine R and Weintz John P
Bought by
Surface Bryan R
Home Financials for this Owner
Home Financials are based on the most recent Mortgage that was taken out on this home.
Original Mortgage
$144,000
Interest Rate
4.87%
Mortgage Type
Fannie Mae Freddie Mac
Purchase Details
Closed on
Aug 22, 1995
Sold by
Miller James Matthew and Miller Jeanne C
Bought by
Weintz Christine R and Weintz John P
Home Financials for this Owner
Home Financials are based on the most recent Mortgage that was taken out on this home.
Original Mortgage
$76,000
Interest Rate
7.43%
Create a Home Valuation Report for This Property
The Home Valuation Report is an in-depth analysis detailing your home's value as well as a comparison with similar homes in the area
Home Values in the Area
Average Home Value in this Area
Purchase History
| Date | Buyer | Sale Price | Title Company |
|---|---|---|---|
| Robinson Christopher J | -- | None Available | |
| R 2 R Investments Llc | $280,000 | None Available | |
| Bodge Eric | $281,000 | -- | |
| Bodge Eric | $281,000 | -- | |
| Sanker Maria | $177,000 | Attorney | |
| Surface Bryan R | $180,000 | -- | |
| Weintz Christine R | -- | -- |
Source: Public Records
Mortgage History
| Date | Status | Borrower | Loan Amount |
|---|---|---|---|
| Open | Robinson Christopher J | $200,500 | |
| Previous Owner | Bodge Eric | $252,900 | |
| Previous Owner | Bodge Eric | -- | |
| Previous Owner | Bodge Eric | -- | |
| Previous Owner | Sanker Maria | $172,513 | |
| Previous Owner | Surface Bryan R | $144,000 | |
| Previous Owner | Weintz Christine R | $76,000 |
Source: Public Records
Tax History
| Year | Tax Paid | Tax Assessment Tax Assessment Total Assessment is a certain percentage of the fair market value that is determined by local assessors to be the total taxable value of land and additions on the property. | Land | Improvement |
|---|---|---|---|---|
| 2025 | $6,213 | $98,001 | $38,798 | $59,203 |
| 2024 | $6,204 | $98,001 | $38,798 | $59,203 |
| 2023 | $6,215 | $98,001 | $38,798 | $59,203 |
| 2022 | $6,932 | $98,351 | $23,272 | $75,079 |
| 2021 | $6,445 | $98,351 | $23,272 | $75,079 |
| 2020 | $6,632 | $98,351 | $23,272 | $75,079 |
| 2019 | $5,941 | $80,588 | $19,394 | $61,194 |
| 2018 | $5,950 | $80,588 | $19,394 | $61,194 |
| 2017 | $5,654 | $80,588 | $19,394 | $61,194 |
| 2016 | $4,809 | $67,526 | $14,739 | $52,787 |
| 2015 | $4,335 | $67,526 | $14,739 | $52,787 |
| 2014 | $4,366 | $67,526 | $14,739 | $52,787 |
| 2013 | $4,075 | $61,951 | $13,521 | $48,430 |
Source: Public Records
Map
Nearby Homes
- 4213 33rd Ave
- 4131 32nd Ave
- 2940 Robertson Ave
- 2945 Three Oaks Ln
- 2901 Three Oaks Ln
- 2942 Three Oaks Ln
- 2921 Three Oaks Ln
- 4425 Pin Oak Cir
- 4421 Pin Oak Cir
- 4417 Pin Oak Cir
- 4413 Pin Oak Cir
- 2934 Three Oaks Ln
- 2920 Three Oaks Ln
- 2905 Three Oaks Ln
- 2932 Three Oaks Ln
- 2930 Three Oaks Ln
- 2906 Three Oaks Ln
- 2926 Three Oaks Ln
- 4454 Water Oak Cir
- 2923 Iron Oak Ave
- 4216 E Thirty Third Ave
- 4220 33rd Ave
- 4214 33rd Ave
- 4222 33rd Ave
- 4210 33rd Ave
- 4210 Thirty Third Ave
- 4226 33rd Ave
- 4206 33rd Ave
- 4211 34th Ave
- 4219 Thirty Third Ave
- 4300 33rd Ave
- 4204 33rd Ave
- 4204 Thirty Third
- 4215 33rd Ave
- 4221 33rd Ave
- 4221 Thirty Fourth Ave
- 4209 34th Ave Unit 2
- 4209 34th Ave Unit 1
- 4211 33rd Ave
- 4219 33rd Ave
Your Personal Tour Guide
Ask me questions while you tour the home.