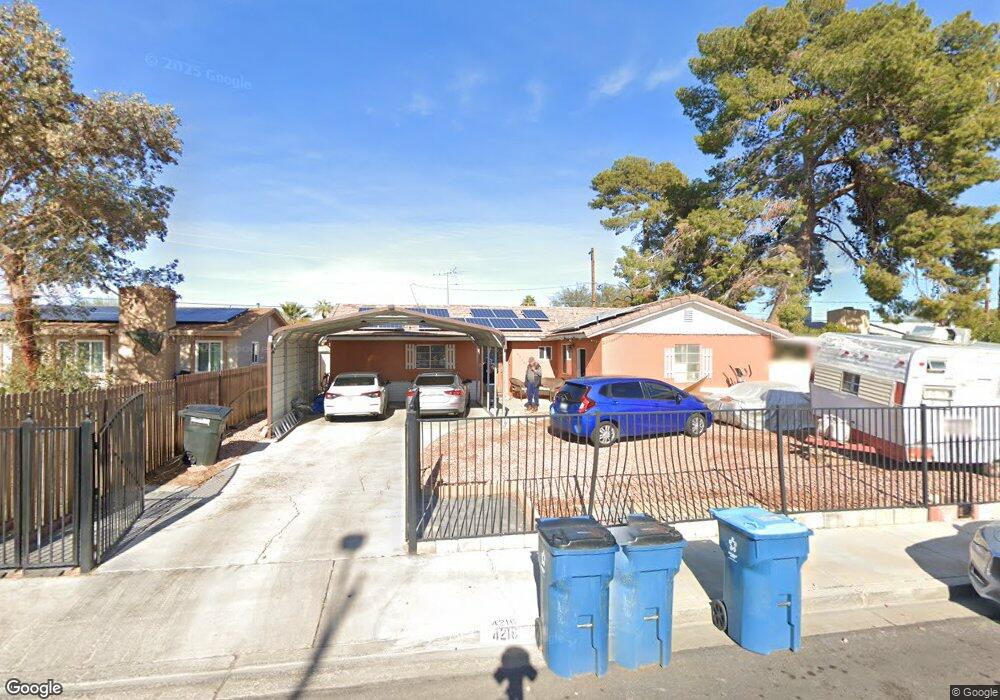
4216 Via Olivero Ave Las Vegas, NV 89102
Buffalo NeighborhoodEstimated Value: $339,000 - $396,067
3
Beds
3
Baths
1,605
Sq Ft
$233/Sq Ft
Est. Value
About This Home
This home is located at 4216 Via Olivero Ave, Las Vegas, NV 89102 and is currently estimated at $373,517, approximately $232 per square foot. 4216 Via Olivero Ave is a home located in Clark County with nearby schools including Vegas Verdes Elementary School, Hyde Park Middle School, and Ed W Clark High School.
Ownership History
Date
Name
Owned For
Owner Type
Purchase Details
Closed on
Aug 13, 2010
Sold by
Sanchez Tomas P Delgado
Bought by
Sanchez Elizabeth Dominguez
Current Estimated Value
Purchase Details
Closed on
Jun 14, 2010
Sold by
Fredericksen Raymond F
Bought by
Fredericksen Jan L
Home Financials for this Owner
Home Financials are based on the most recent Mortgage that was taken out on this home.
Original Mortgage
$101,631
Interest Rate
4.87%
Mortgage Type
FHA
Purchase Details
Closed on
Jun 11, 2010
Sold by
Balle Jill L and Fredericksen Jan L
Bought by
Sanchez Elizabeth Dominguez
Home Financials for this Owner
Home Financials are based on the most recent Mortgage that was taken out on this home.
Original Mortgage
$101,631
Interest Rate
4.87%
Mortgage Type
FHA
Purchase Details
Closed on
Mar 29, 2006
Sold by
Himstedt Jack D and Hudson Karen
Bought by
Balle Jill L and Fredericksen Jan L
Create a Home Valuation Report for This Property
The Home Valuation Report is an in-depth analysis detailing your home's value as well as a comparison with similar homes in the area
Home Values in the Area
Average Home Value in this Area
Purchase History
| Date | Buyer | Sale Price | Title Company |
|---|---|---|---|
| Sanchez Elizabeth Dominguez | -- | Noble Title | |
| Fredericksen Jan L | -- | Noble Title | |
| Balle Jill L | -- | Noble Title | |
| Sanchez Elizabeth Dominguez | $103,000 | Noble Title | |
| Balle Jill L | -- | None Available |
Source: Public Records
Mortgage History
| Date | Status | Borrower | Loan Amount |
|---|---|---|---|
| Previous Owner | Sanchez Elizabeth Dominguez | $101,631 |
Source: Public Records
Tax History Compared to Growth
Tax History
| Year | Tax Paid | Tax Assessment Tax Assessment Total Assessment is a certain percentage of the fair market value that is determined by local assessors to be the total taxable value of land and additions on the property. | Land | Improvement |
|---|---|---|---|---|
| 2025 | $1,406 | $67,225 | $37,800 | $29,425 |
| 2024 | $1,366 | $67,225 | $37,800 | $29,425 |
| 2023 | $1,102 | $59,029 | $32,550 | $26,479 |
| 2022 | $1,326 | $51,420 | $27,650 | $23,770 |
| 2021 | $1,288 | $47,614 | $25,550 | $22,064 |
| 2020 | $1,247 | $45,237 | $23,800 | $21,437 |
| 2019 | $1,232 | $40,457 | $18,550 | $21,907 |
| 2018 | $1,178 | $40,399 | $18,550 | $21,849 |
| 2017 | $1,255 | $38,290 | $15,400 | $22,890 |
| 2016 | $1,102 | $37,448 | $13,300 | $24,148 |
| 2015 | $1,098 | $32,957 | $8,750 | $24,207 |
| 2014 | $1,066 | $22,038 | $6,650 | $15,388 |
Source: Public Records
Map
Nearby Homes
- 4100 Via Olivero Ave
- 4013 El Camino Ave
- 2101 Las Flores St
- 2005 Fontenelle St
- 4117 El Cederal Ave
- 2205 Las Verdes St
- 2013 Las Verdes St
- 1904 Fontenelle St
- 2008 El Mirador St
- 2521 Lenna St
- 4313 El Conlon Ave
- 4321 El Conlon Ave
- 1905 Aquarius Dr
- 2116 Cameron St
- 1647 Los Altos Place
- 3909 W Oakey Blvd
- 4742 Obannon Dr Unit A
- 4706 Obannon Dr Unit C
- 4708 Obannon Dr Unit C
- 4720 Obannon Dr Unit D
- 4212 Via Olivero Ave
- 4220 Via Olivero Ave
- 4217 El Camino Ave
- 4213 El Camino Ave
- 4213 El Camino Ave
- 4221 El Camino Ave
- 4208 Via Olivero Ave
- 4300 Via Olivero Ave
- 4209 El Camino Ave
- 4215 Via Olivero Ave
- 4301 El Camino Ave
- 4209 Via Olivero Ave
- 4219 Via Olivero Ave
- 4204 Via Olivero Ave
- 4304 Via Olivero Ave
- 4205 Via Olivero Ave
- 4205 El Camino Ave
- 4301 Via Olivero Ave
- 4305 El Camino Ave
- 4201 Via Olivero Ave