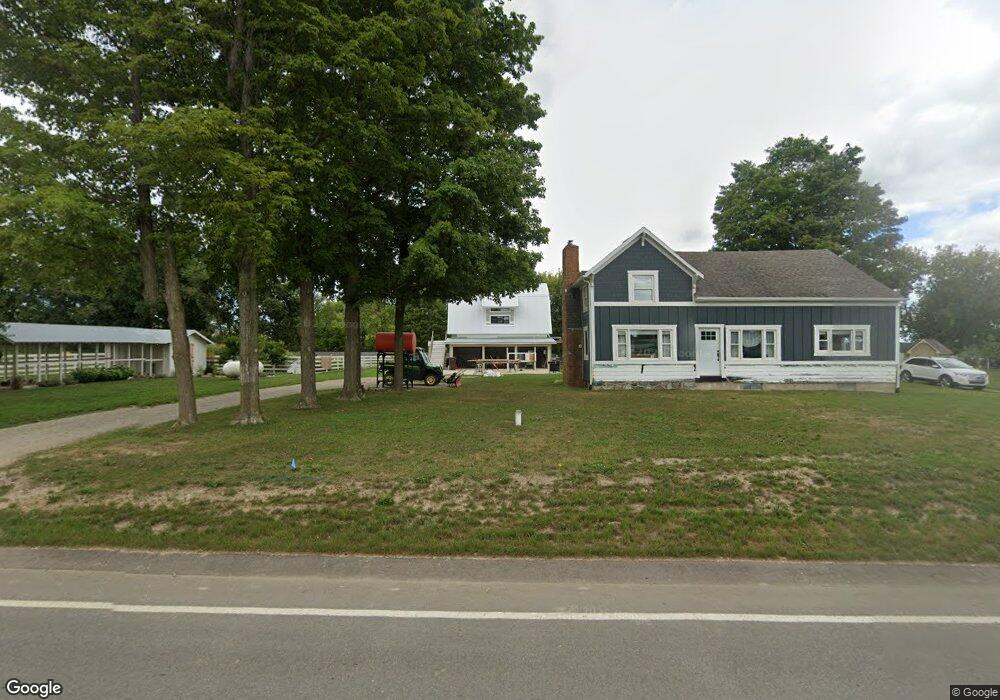
4217 12th St Wayland, MI 49348
Estimated Value: $205,000 - $406,000
1
Bed
2
Baths
1,877
Sq Ft
$175/Sq Ft
Est. Value
About This Home
This home is located at 4217 12th St, Wayland, MI 49348 and is currently estimated at $328,734, approximately $175 per square foot. 4217 12th St is a home located in Allegan County with nearby schools including Wayland High School, Moline Christian School, and St. Therese Catholic School.
Ownership History
Date
Name
Owned For
Owner Type
Purchase Details
Closed on
Jan 31, 2019
Sold by
Kwekel Eric
Bought by
Kwekel Eric S and Kwekel Melissa R
Current Estimated Value
Purchase Details
Closed on
Sep 20, 2013
Sold by
Reocycle Llc
Bought by
Kwekel Eric
Purchase Details
Closed on
Jul 25, 2013
Sold by
Popp Jeannine D and Battjes David J
Bought by
Reocycle Llc
Purchase Details
Closed on
May 16, 2013
Sold by
Battjes David M and Battjes Jeannine D
Bought by
Reocyle Llc
Purchase Details
Closed on
Mar 29, 2010
Sold by
Battjes David Michael
Bought by
Battjes Jeannine Dee Popp
Purchase Details
Closed on
May 16, 1997
Sold by
Genther Eileen
Bought by
Battjes David M and Battjes Jeannine
Create a Home Valuation Report for This Property
The Home Valuation Report is an in-depth analysis detailing your home's value as well as a comparison with similar homes in the area
Home Values in the Area
Average Home Value in this Area
Purchase History
| Date | Buyer | Sale Price | Title Company |
|---|---|---|---|
| Kwekel Eric S | -- | None Available | |
| Kwekel Eric | $65,000 | Group Title Agency Services | |
| Reocycle Llc | -- | None Available | |
| Reocyle Llc | $43,357 | None Available | |
| Battjes Jeannine Dee Popp | -- | None Available | |
| Battjes David M | $100,000 | -- |
Source: Public Records
Tax History Compared to Growth
Tax History
| Year | Tax Paid | Tax Assessment Tax Assessment Total Assessment is a certain percentage of the fair market value that is determined by local assessors to be the total taxable value of land and additions on the property. | Land | Improvement |
|---|---|---|---|---|
| 2025 | $3,093 | $155,100 | $30,900 | $124,200 |
| 2024 | $2,736 | $151,000 | $28,200 | $122,800 |
| 2023 | $2,736 | $133,700 | $28,200 | $105,500 |
| 2022 | $2,736 | $129,000 | $28,200 | $100,800 |
| 2021 | $2,119 | $110,700 | $31,900 | $78,800 |
| 2020 | $2,095 | $103,700 | $31,000 | $72,700 |
| 2019 | $2,034 | $93,900 | $29,700 | $64,200 |
| 2018 | $1,960 | $92,200 | $29,700 | $62,500 |
| 2017 | $0 | $87,400 | $29,700 | $57,700 |
| 2016 | $0 | $69,000 | $29,700 | $39,300 |
| 2015 | -- | $69,000 | $29,700 | $39,300 |
| 2014 | -- | $62,400 | $27,000 | $35,400 |
| 2013 | $1,878 | $59,500 | $27,000 | $32,500 |
Source: Public Records
Map
Nearby Homes
- 4316 Sussex Place
- 4273 Highpoint Dr Unit 112
- 4335 Tavistock Dr
- Unit 111 Highpoint Dr
- 4351 Hickory View Ct
- 4240 Butternut Dr
- Vienna Plan at Harvest Meadows
- Charlotte Plan at Harvest Meadows
- Sierra Plan at Harvest Meadows
- Karolynn Plan at Harvest Meadows
- Reno Plan at Harvest Meadows
- Bayberry Plan at Harvest Meadows
- Freedom Plan at Harvest Meadows
- London Plan at Harvest Meadows
- Hampton Plan at Harvest Meadows
- Oxford Plan at Harvest Meadows
- Lot 142 Butternut Dr
- Lot 141 Butternut Dr
- 4243 Butternut Dr
- 4245 Butternut Dr